

XRPUSD Medium-term Trend: Ranging
Supply Levels: $0.51, $0.50, $0.49
Demand levels: $0.45, $0.46, $0.47
Last week, price of Ripple depreciated on a daily basis. In fact, On Monday 26, price fell from $0.58 to $0.48 on Friday, March 26, 2018. From the weekly chart, price of Ripple is in the process of bearish trend reversal. Meanwhile, the RSI period 14 is level 52 which indicates that price is in the range bound zone.
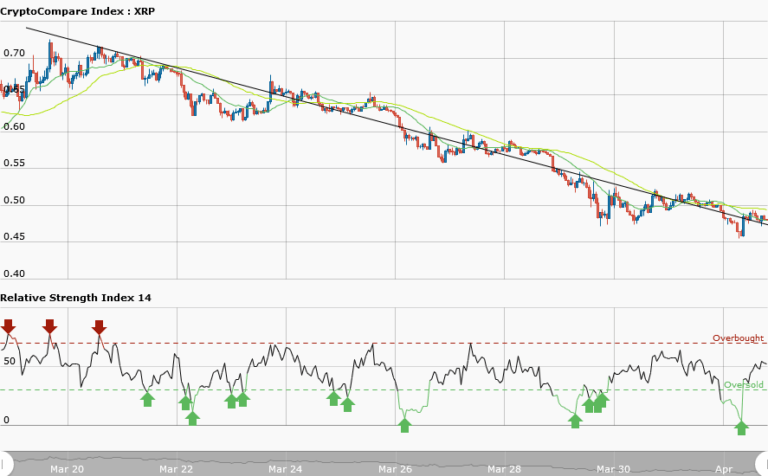
XRPUSD Short-term Trend: Ranging

In daily chart, price of Ripple is ranging. Price fell from $0.50 to $0.46 and retraced to fall again to its low before it rose to its present level of $0.48. Meanwhile, the RSI period 14 is level 40 which indicates that price is in the range bound zone. When market is consolidating or in a range bound zone; there is the possibility of a breakout.
I am expecting the price to break the resistance level at $0.45 before it will reach its previous level of $0.60 and $0.80
The views and opinions expressed here do not reflect that of CryptoGlobe.com and do not constitute financial advice. Always do your own research


