

XRPUSD Medium-term Trend: Bullish
Supply Levels: $0.80, $0.75, $0.70
Demand levels: $0.50, $0.55, $0.60
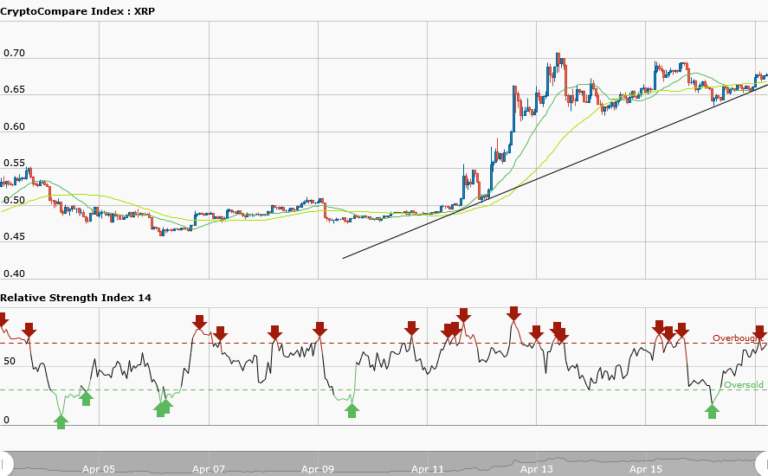
Ripple price is in a bullish market and is currently trading at $0.67. However, from the weekly chart, the XRPUSD pair has made concerted efforts to break the resistance level at $0.70. The first time was on April 13, when the price hit the resistance level at $0.70 and it pulled back to the range bound zone, at $0.65. The market ranged for two days at that price level.
On April 15, Ripple price made another attempt to break the resistance at $0.70 but failed. Today, the LTCUSD pair is making another attempt, but trading at $0.67 at the time of writing. If the bulls break the resistance at $0.70, the price will reach another high of $0.80 or $1.00. However, the RSI period 14 is level 69, which indicates that price is in the bullish trend zone.
XRPUSD Short-term Trend: Bullish

In the daily chart, Ripple price is in a smooth uptrend and it’s making a series of higher highs and higher lows. The bullish trend line is drawn across the price bars. The price bars are touching the support levels where traders can place long trades.
The views and opinions expressed here do not reflect that of CryptoGlobe.com and do not constitute financial advice. Always do your own research.


