

XRPUSD Medium-term Trend: Ranging
Supply Levels: $0.68, $0.67, $0.66
Demand levels: $0.63, $0.64, $0.65
Price of Ripple had bullish breakout and the bulls are sustaining that level. However, they are yet to reach its previous level of price at $0.70 because it encountered resistance by the bears. Nevertheless, from the weekly chart, price of Ripple rose in the bullish trend to reach price at $0.70, later it fell to the low of $0.65 to resume its range bound movement.
Ripple is expected to retest the resistance level at $0.70 and if it breaks it, price will reach its previous high of $0.80. If the bulls fail to break the resistance level at $0.70, price may continue its range bound movement. The 20-day moving average is above the 50-day moving average and is trending northward indicating bullish outlook.
XRPUSD Short-term Trend: Ranging

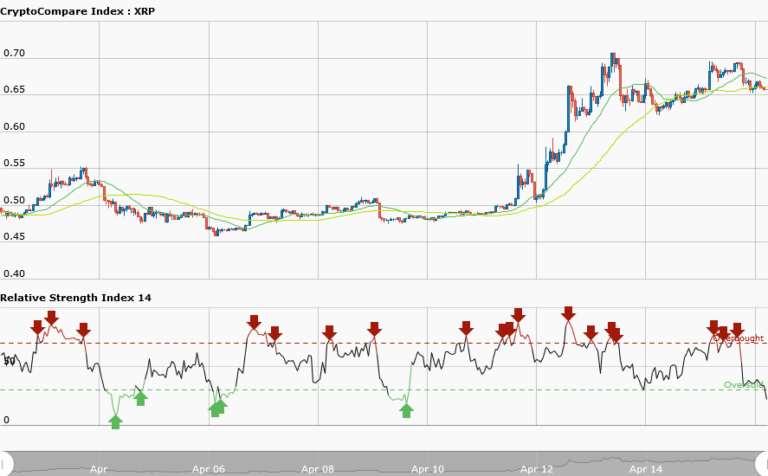
In the daily chart, price of Ripple has a bearish outlook. The bearish outlook is the period of price fall after price reached its peak, and retraced to commence a range bound movement. The RSI period 14 is level 38 which indicates that the market is oversold suggesting bulls to take over the market.
The views and opinions expressed here do not reflect that of CryptoGlobe.com and do not constitute financial advice. Always do your own research


