

XRPUSD Medium-term Trend: Bullish
Supply Levels: $0.80, $0.75, $0.70
Demand levels: $0.50, $0.55, $0.60
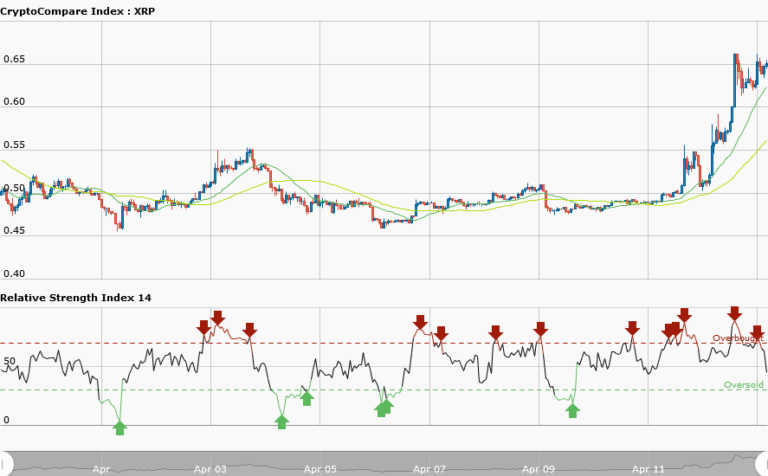
The XRPUSD pair had a break out from the range bound zone. Yesterday, the forecast was that price will reach the previous high of $0.65 but it is currently trading at $0.68. From the weekly chart, price of Ripple had been trading in the range of $0.46 to $0.50 for the past two weeks. The price bars of Ripple were ranging horizontally before the bullish break out on April 12, 2018. The breakout candlesticks can be seen with the rising moving averages.
However, if the bulls can pull through the resistance levels of $0.70 and $0.80, price of Ripple will test the previous level of $0.90.
XRPUSD Short-term Trend: Bullish

In the daily chart, price of Ripple is bullish. The XRPUSD pair was trading at $0.55 and was in a range bound movement before the breakout occurs and the bulls took price to the level at $0.65. Even at the resistance of $0.65, the bulls continue to hold price in range bound movement. Meanwhile, the RSI period 14 is level 64 which indicates that price is in the bullish trend zone.
The views and opinions expressed here do not reflect that of CryptoGlobe.com and do not constitute financial advice. Always do your own research


