

NEOUSD Medium-term Trend: Bearish
Supply zones: $60.00, $70.00, $80.00
Demand zones: $50.00, $40.00, $30.00
Neo is in a downtrend. The bullish move was rejected at $54.41 price level. Momentum to the downside is more as we can see more bearish candle formation below the three exponential moving averages. Stochastic oscillator signal lines have crossed each other and are pointing down. This confirms the bear pressure. Possibility of price testing demand zone at $50.00 is likely, which could result in the formation of double bottom at this level. A break and close of the daily candle below this demand zone could possibly bring the price down further to $40.00, while a break above the $55.00 will lead to bullish trend continuation.

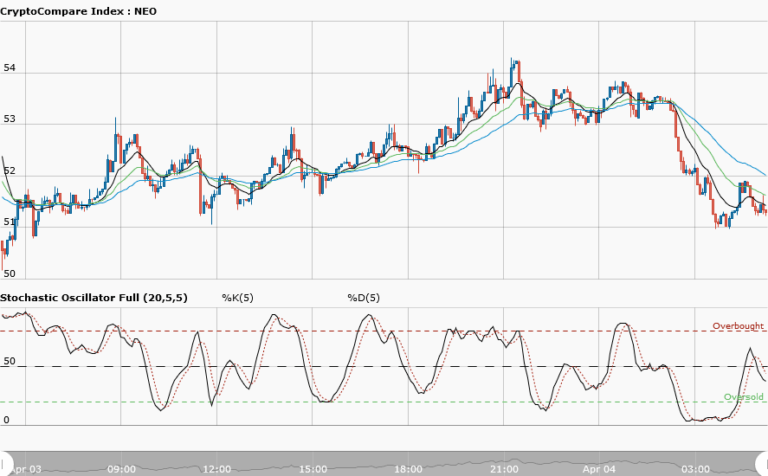
NEOUSD Short-term Trend: Bearish
Neo is in a downtrend against the nice move to the upside that we saw yesterday. This could likely be the minor retracement mentioned in yesterday analysis. Double bottom formation is likely around $51.1 price level, which could be a nice area for the bulls to set in. The stochastic oscillator approaching the overbought region. Traders should be patient and allow for good confluence confirmation before taking a position.
The views and opinions expressed here do not reflect that of CryptoGlobe.com and do not constitute financial advice. Always do your own research.


