XMRUSD Medium-term Trend: Bullish
Supply zones: $320.00, $340.00, $360.00
Demand zones: $180.00, $160.00, $140.00
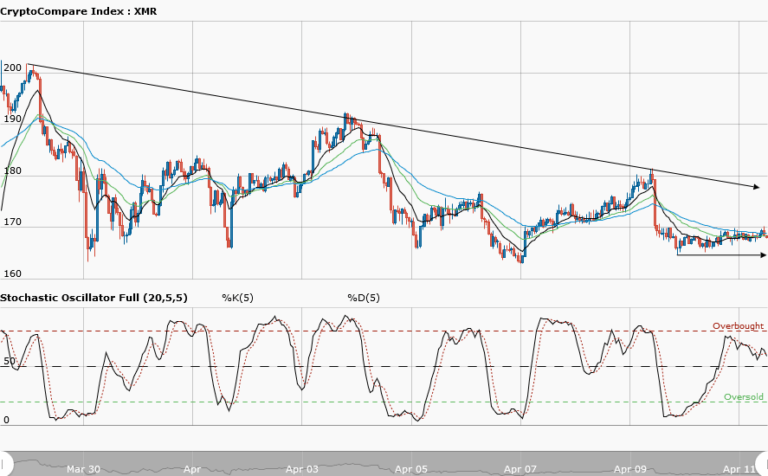
Monero‘s bullish trend is still intact in the medium-term outlook. However, the bullish move was abruptly halted by a massive bearish pressure earlier today, with engulfing candles below the three exponential moving averages crossover. The sellers pushed the price down from the supply zone at $298.88 to the $240.00 demand area. This should be seen as a retracement for the upward trend continuation. The $240.00 demand area is critical. We see a double bottom formation here, which is obviously a bearish rejection. As long as the price does not break this demand area, the bullish outlook still remains valid. The Stochastic Oscillator is in the oversold region with its signal pointing up, suggesting an upward momentum. We are likely to see more bullish candle formed above the exponential moving averages crossover. This will usher the bulls back to the market on a stronger note.
XMRUSD Short-term Trend: Bullish
The bulls’ momentum seems weak in the short-term although Monero’s daily opening price ($296.05) was higher than yesterday ($283.51). The bears’ pressure overpowered the upward momentum and drove the price first to the demand area at $260.00 and later to the $240.00 area. A double bottom formation at $240.00 is notable. The bulls pushed the price to the $270.00 supply area. Most likely, the bulls will step up, as the momentum increases and the stochastic oscillator leaves the overbought region. The break of the $270.00 supply area is very probable as more bullish candles are formed and closed above the exponential moving averages.
The views and opinions expressed here do not reflect that of CryptoGlobe.com and do not constitute financial advice. Always do your own research.


