
XMRUSD Long-term Trend: Bearish
Supply zone: $200.00, $220.00, $240.00
Demand zone: $150.00, $130.00, $110.00
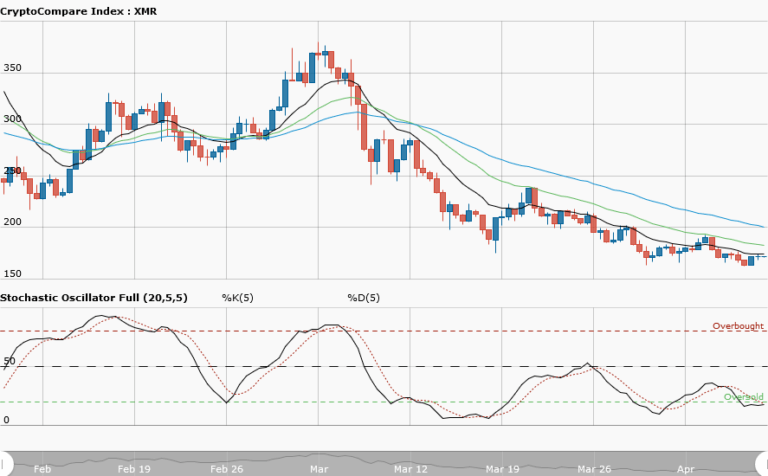
Monero has continually witnessed a downtrend over the past weeks and price making lower lows which indicates strong selling pressure. The formation of bullish pin bar on April 1st, a reversal signal, from opening of $174.79 momentary took price to a high of $192.39 on April 3rd. With stochastic oscillator in the oversold region at the 35 percent level, all was set for a bullish continuation but this was short-lived with the formation of a bearish candle on 4th of April dragging price down to as low as $160.92.

XMRUSD is still on a downward journey in the long term. Candles formed and closed below the three exponential moving averages also confirms this. Moreover the moving averages are fanned apart, indicative of strong trend. Key supply zone exist at $200.00 while demand zone could easily be identify at $150.00.The week ahead could momentarily bring about a brief momentum to the upside as this week was started with a bullish doji candle, but the sellers could possibly force price further down as the overall trend favour them.
The views and opinions expressed here do not reflect that of CryptoGlobe.com and do not constitute financial advice. Always do your own research.


