

LTCUSD Medium-term Trend: Bullish
Resistance: $154, $153, $ 152
Support: $148, $149, $150
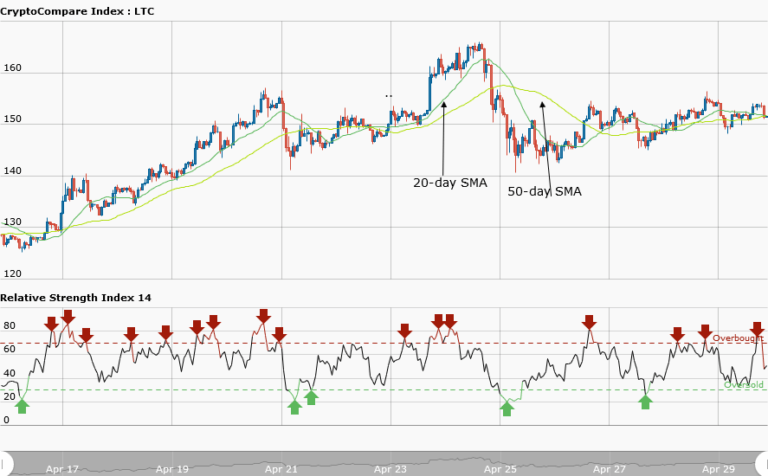
The LTCUSD pair was also bullish throughout last week which made the price reach $166. The bulls were then resisted, bringing the price down to $141. At this level, the price went into a range bound movement between the $150 resistance level and the $140 support level. Litecoin was trading at $151.21 at the time of writing.
However, the weekly chart shows the Litecoin price is ranging from the $150 price level. If the range bound movement continues, the price may encounter another breakout on any of the levels. Nevertheless, if the bulls do not sustain the price level, the bears may take the price below the $150 level. The relative strength index period 14 is level 50, which indicates that price is in the range bound zone.
LTCUSD Short-term Trend: Ranging

The daily chart shows Litecoin in a range bound movement. The price fell from $154 to $149 and started a range bound movement. The price is now in a choppy action and it is not evenly apart between the resistance level and support level, which makes trading not possible.
The views and opinions expressed here do not reflect that of CryptoGlobe.com and do not constitute financial advice. Always do your own research.


