
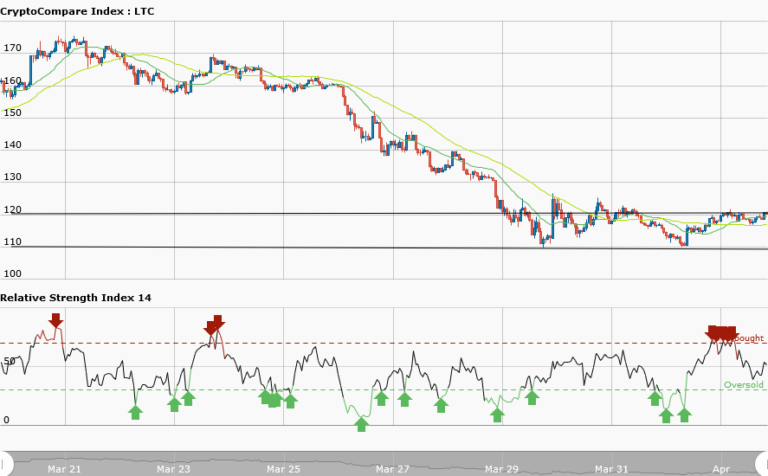

LTCUSD Medium-term Trend: Ranging
Resistance: $124, $123, $122
Support: $118, $119, $120
The LTCUSD pair is in a range bound movement since March 29, 2018. Price is oscillating between the resistance at $120 and the support at $110. It is currently trading at $120.28. Price made false breakout twice at the resistance level but later fell into the trading range. Later it bounced at the support level and commenced its range bound movement within the key levels.
There is the possibility of a breakout at the resistance level. If price breaks the resistance level, traders should take long positions. However, price may not break the support level but if it does traders should take short positions.
LTCUSD Short-term Trend: Ranging

Price of Litecon is also trading in a ranging market in the daily chart. Unlike Ethereun, price of Litecoin is evenly apart between the resistance and the support levels. In this case, traders may choose to trade the ranging market in the short term trend. If you had followed the trend at its inception, you take a long trade at the support of $117 and a short trade at the resistance of $121.
However, you can exit your long trades when price gets to the resistance zone and exit your short trades when price gets to the support zone.
The views and opinions expressed here do not reflect that of CryptoGlobe.com and do not constitute financial advice. Always do your own research


