

LTCUSD Medium-term Trend: Bearish
Resistance: $150, $148, $146
Support: $138, $140, $142
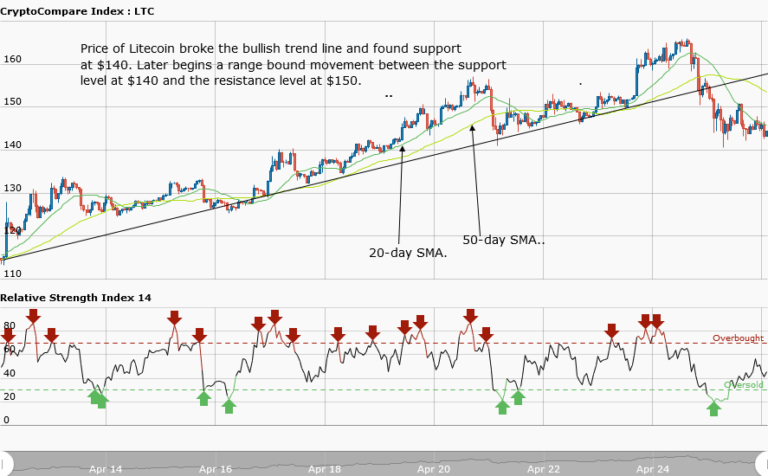
The LTCUSD pair reached the high of $160, however, the bulls were resisted at the price of $160 and price pulled back to the low of $140. Secondly, the pullback resulted in the breaking of the bullish trend line which brings to an end the current bullish trend. As price fell, Litecoin found a support at a low of $140.
However, price of Litecoin is now fluctuating between the support level at $140 and the resistance level at $150. If price of the asset continues with its range bound movement between these level, then a breakout will ensue. If price breaks the level at $150, traders should place long orders. On the other hand, if price breaks the level at $140, then traders should short their trades.
Meanwhile, relative strength index period 14 is level 41 which indicates that price is in the range bound zone.
LTCUSD Short-term Trend: Ranging

In the daily chart, price of Litecoin is in a range bound movement. We can adopt the range bound strategy to trade the daily chart. A perfect ranging market is where the price action is not choppy. That is the price of the asset is evenly apart between the resistance level and the support level.
The views and opinions expressed here do not reflect that of CryptoGlobe.com and do not constitute financial advice. Always do your own research.


