

LTCUSD Medium-term Trend: Bullish
Resistance: $160, $155, $150
Support: $130, $135, $140
Yesterday, the LTCUSD pair was trading in a bullish market. Traders who wish to place their trades should do so at $150, with a stop loss at $140. However, Litecoin price was trading above $160 but the bulls could not hold onto it. Presently, Litecoin is trading at $149.30.
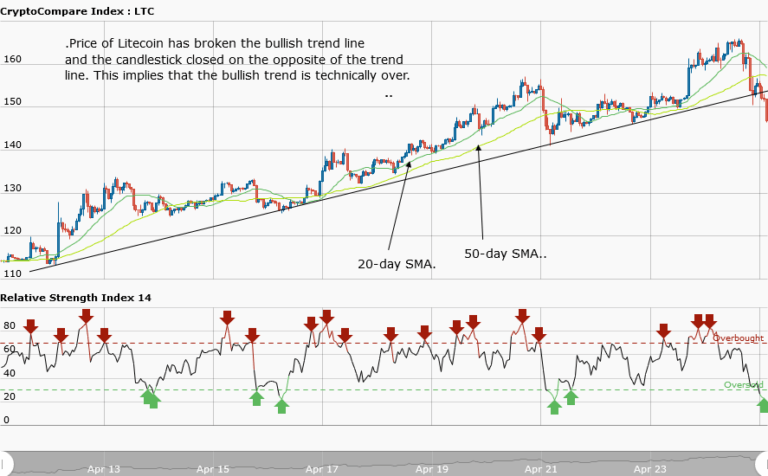
However, the weekly chart shows that the price pulled back and broke the bullish trend line. The candlestick closed on the opposite of the trend line. Technically, the implication of this price action is that the bullish trend is over. Therefore, traders should close all their opened long trades.The price may consolidate at the support of $140 and will make a range bound movement.
The relative strength index period 14 is level 26 which indicates that the market is oversold, suggesting the bulls will take control of the market.
LTCUSD Short-term Trend: Ranging

The daily chart shows the downtrend of the price. The bulls took the price to the resistance level at $160 and then went into a range bound movement and later fell to the $145 low.
The views and opinions expressed here do not reflect that of CryptoGlobe.com and do not constitute financial advice. Always do your own research.


