

LTCUSD Medium-term Trend: Ranging
Resistance: $119, $118, $117
Support: $113, $114, $115
Last week, LTCUSD pair was in a bearish view all through the week. Price broke the support level at $140 which brought price to its low at $111.80 on Friday 30, 2018. From the Weekly chart, the downtrend which was in place since March 20, 2018 has ended. The price broke the bearish trend line and the candlestick closing on the opposite of the trend line.
The RSI period 14 is level 60 which indicates that price is in the bullish trend zone. The first hurdle for the bulls is to break the resistance level at $150 before it can reach its previous level at $200 or $250. Presently, Litecoin is trading at $118.50 as at the time of writing.
LTCUSD Short-term Trend: Ranging

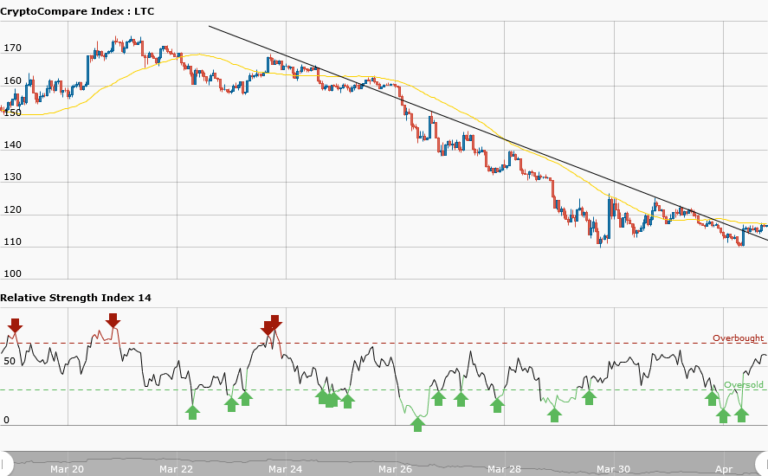
In the daily chart, price of Litecoin is in the range bound movement. Price fell from $117 to its low at $110 and rose again to $116 before commencing its range bound movement. Meanwhile, the RSI period 14 is level 46 which indicates that price is in the range bound zone. Price is likely to consolidate at $120 before its eventual breakout in favor of the bulls.
The views and opinions expressed here do not reflect that of CryptoGlobe.com and do not constitute financial advice. Always do your own research


