

LTCUSD Medium-term Trend: Bullish
Resistance: $155, $150, $145
Support: $125, $130, $135
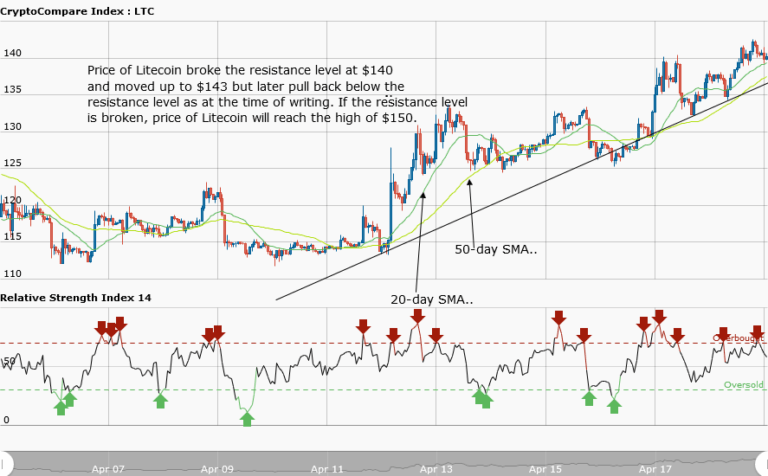
Yesterday, Litecoin was in a bullish market. It was forecasted that if price broke the resistance at $140, Litecoin would be able to reach the high of $150. However, from the weekly chart, price of Litecoin broke the resistance and moved up to $143, but it pulled back below the resistance level of $140. It is currently trading at $139.51. Price of Litecoin is likely to rise because the 20-day moving average is above the 50-day moving average.
Also, take a note from the bullish trend line. As you can see, the bullish trend line shows the support levels of price where traders can place their long orders. When an asset retraces or pulls back to the trend line, then traders can place their long trades.
LTCUSD Short-term Trend: Bullish

In the daily chart, the bullish trend of the asset commenced at a price of $134, and moved in the pattern of higher highs and higher lows, up to $143. At a price of $143, it pulled back to the level at $140. At that level, the price corrections commenced and it is currently trading at $140.87. Meanwhile, the RSI period 14 is level 62 which indicates that price is the bullish trend zone.
The views and opinions expressed here do not reflect that of CryptoGlobe.com and do not constitute financial advice. Always do your own research.


