

LTCUSD Medium-term Trend: Bullish
Resistance: $150, $145, $140
Support: $120, $125, $130
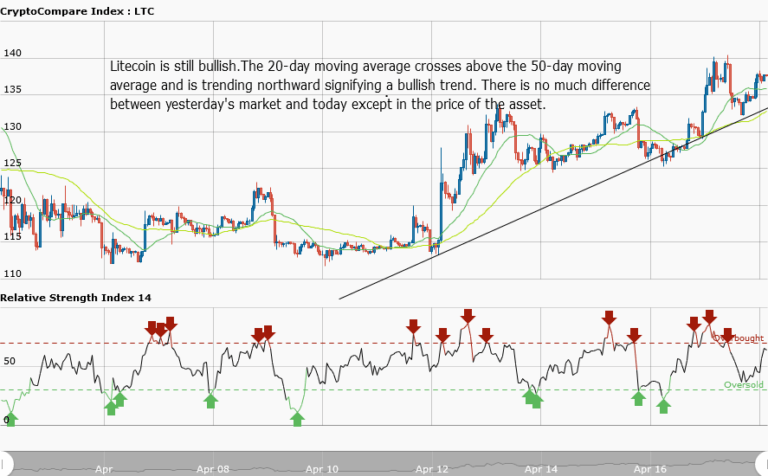
The LTCUSD pair is in a bullish trend. The bulls are pushing the price towards the $140 high. The asset price is currently trading at $137.08. However, from the weekly chart, a bullish trend line is drawn across the price bars, showing us the price support levels where traders can go long. The 20-day moving average crosses above the 50-day moving average, indicating that the Litecoin price is rising.
Also, the RSI period 14 is level 65, which indicates that the price is in a bullish trend zone. Looking at these indicators, the price is expected to break the resistance level at $140. Then the LTCUSD pair will be able to reach other highs of $150 and beyond.
LTCUSD Short-term Trend: Ranging

In the daily chart, we see the Litecoin price in a perfect ranging market, where the price action is evenly apart between the resistance level and support level. If you followed the ranging market from the onset, you will take the following trades. At the resistance level, you take a short trade and exit near the support zone. At the support level, when the buy setup shows up, you take a long trade and exit near the resistance zone.
For your short trades, your stop loss should be above the resistance level while your stop loss for long trades should be below the support level.
The views and opinions expressed here do not reflect that of CryptoGlobe.com and do not constitute financial advice. Always do your own research.


