
LTCUSD Medium-term Trend: Bullish
Resistance: $145, $140, $135
Support: $120, $125, $130
Yesterday, the LTCUSD pair broke the resistance level at $130 to come out of the range-bound zone. However, price of Litecoin retraced back to the range bound zone.
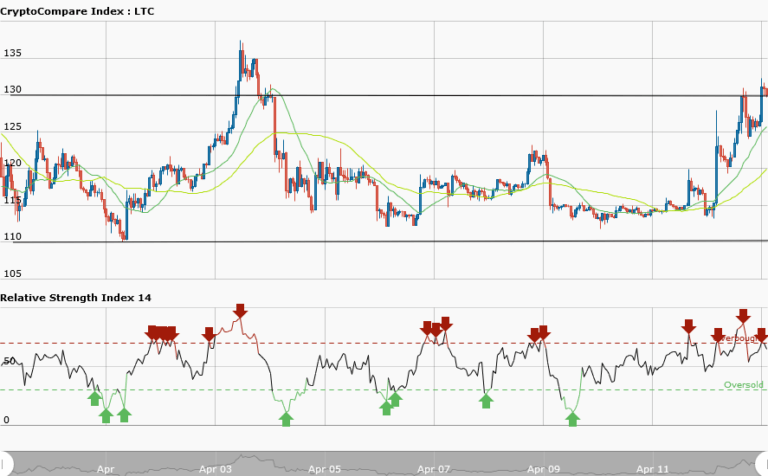
It is trading at $128.82 as at the time of writing. From the weekly chart, the 20-day moving average is above the 50-day moving average indicating that Litecoin is rising. Price of Litecoin is expected to rise and push price through the $130 and $140 price levels so as to reach the previous high of $160. Meanwhile, the RSI period 14 is level 69 which indicates that price is in the bullish trend zone.
LTCUSD Short-term Trend: Bullish

In the daily chart, price of Litecoin is in an uptrend. The bullish trend line shows the support levels with pointed arrows where traders can place long trades. In an uptrend, price will make a series of higher highs and higher lows. Also, note that if price retraces from the recent high, it will create a support level. Trader who wish to go long can enter a position as price pulls back to the support level.
The views and opinions expressed here do not reflect that of CryptoGlobe.com and do not constitute financial advice. Always do your own research.