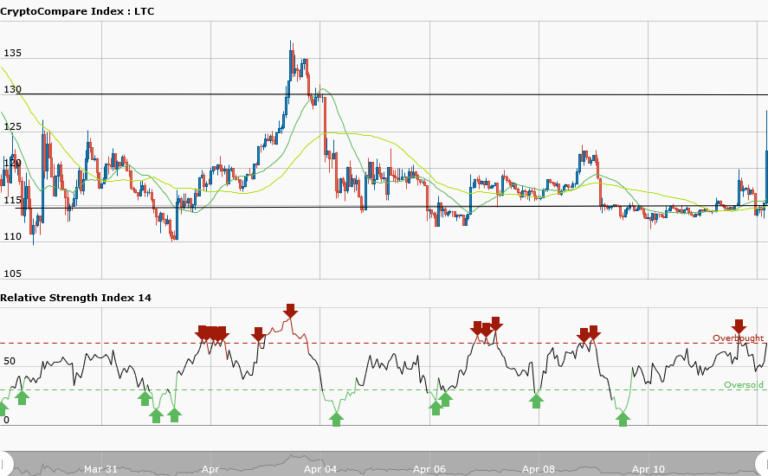
LTCUSD Medium-term Trend: Ranging
Resistance: $128, $126, $124
Support: $116, $118, $120
Yesterday, it was mentioned that price of Litecoin has been ranged bound since April 5 and that the possibility of a breakout cannot be ruled out. Now the bulls have taken control of the market. From yesterday’s trading price of $114 it has risen to $123.48 at the time of writing.
From the weekly chart, the Litecoin price, which was ranging at $114, suddenly rose to $126 during a price spike. It later fell to $123.48. The price correction began as price moved in the direction of the bullish trend. The price is expected to break the resistance of $130 if the bulls continue to push it forward.
LTCUSD Short-term Trend: Ranging
In the daily chart, Litecoin price has broken the resistance at $120. The LTCUSD pair had been ranging for over a week. The bulls have taken control after a long period of bearish pressure. Meanwhile, the 20-day moving average is above the 50-day moving average, indicating the rise of Litecoin price. The RSI period 14 is level 72 which indicates that the market is overbought, suggesting the bears taking control of the market.
The views and opinions expressed here do not reflect that of CryptoGlobe.com and do not constitute financial advice. Always do your own research.


