

LTCUSD Medium-term Trend: Ranging
Resistance: $117, $116, $115
Support: $111, $112, $113
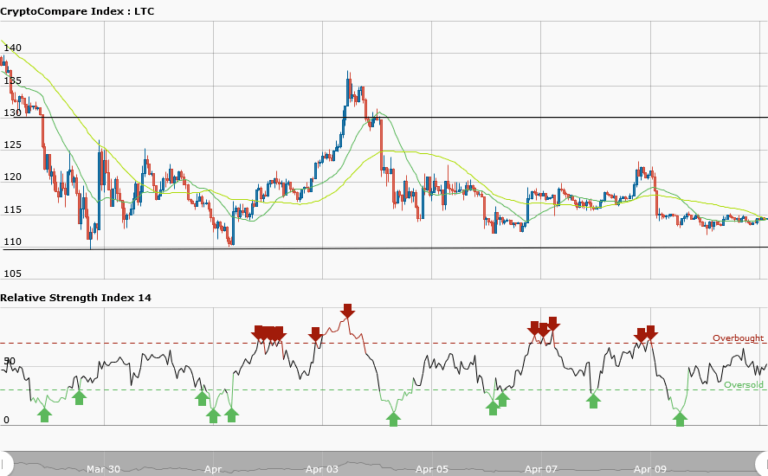
The LTCUSD pair has been range bound since April 5, 2018. Presently, it is trading at $114.32. In the weekly chart the last bearish pressure brought the price of Litecoin to $114. Litecoin has been trading for a week at that price level in a ranging market. Presently, the Litecoin price is fluctuating between the resistance level at $130 and the support level at $110.
However, since the price has been ranging for a week, the possibility of a breakout cannot be ruled out. Meanwhile, the RSI period 14 is level 52 which indicates that price is in the range bound zone. The price of Litecoin may continue its range bound movement as per the RSI indicator.
LTCUSD Short-term Trend: Ranging

Litecoin price is range bound in the daily chart. A range bound market is where the bulls or bears have no control of the market. Therefore traders are advised to abstain from trading, because the direction of the market is unknown. From the daily chart, Litecoin has a choppy price action. A choppy market has price in disarray.
The views and opinions expressed here do not reflect that of CryptoGlobe.com and do not constitute financial advice. Always do your own research


