
LTCUSD Medium-term Trend: Ranging
Resistance: $120, $118, $116
Support: $108, $110, $112
Price of Litecoin has been constant in price in its range bound movement. Yesterday, it traded at $114.11, but today it is trading at $113.50. However, from the weekly chart, LTCUSD pair is ranging in a horizontal pattern. It has a serious choppy price action. As the price of Litecoin is consolidating in price near the support level, there is the possibility of a breakout.
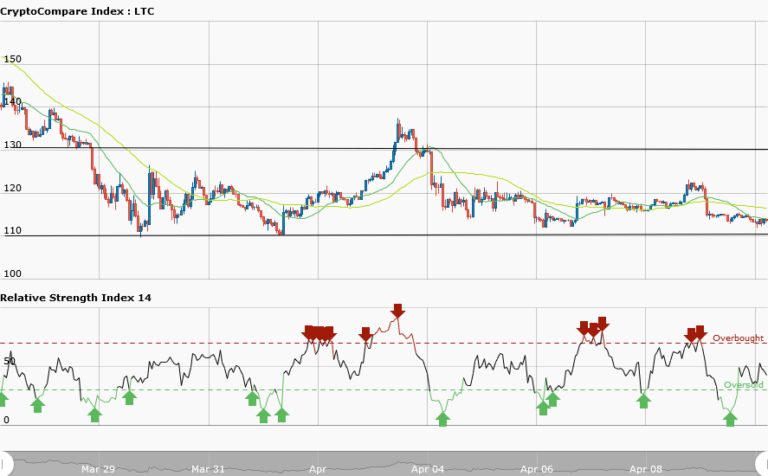
However, price of Litecoin is presently fluctuating between the resistance at $130 and the support at $110. If the bears break the support level at $110, traders should place short orders and exit at the low of $90. But if the bulls hold on to the price at that level, then the range bound movement will continue.
LTCUSD Short-term Trend: Ranging

In the daily chart, LTCUSD pair is ranging between the resistance at $115 and the support at $112. Price of Litecoin is not evenly apart the resistance and the support level, therefore trading becomes difficult. Meanwhile, the RSI period 14 is level 41, which indicates that price is in the range bound zone.
The views and opinions expressed here do not reflect that of CryptoGlobe.com and do not constitute financial advice. Always do your own research