

ETHUSD Medium-term Trend: Bullish
Resistance: $445, $440, $435
Support: $415, $420, $425
ETHUSD pair has been relatively stable last week and there was little or no activity. Price of Ethereum was at $382.21 at the beginning of the week, but on Wednesday, April 4, the bulls were in control and took price to $415.57. The bullish trend was short lived as the bears took price again to its previous level at $370.65. Today, Ethereum is trading at $412.31 as at the time of writing.
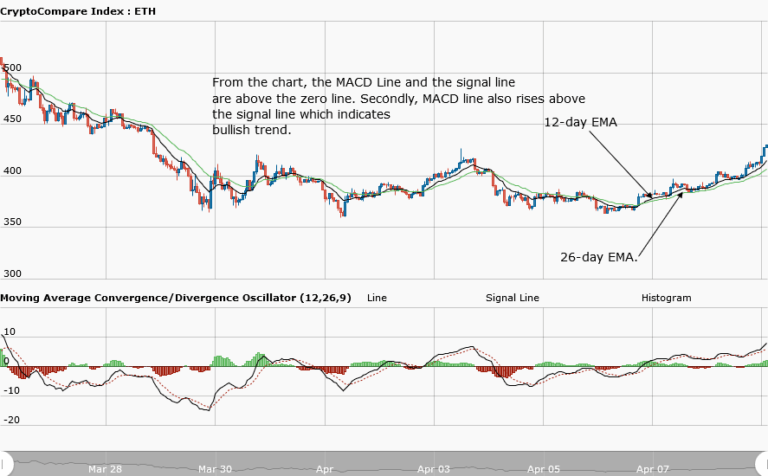
From the weekly chart, price of the asset is above the 12-day EMA and 26-day EMA indicating that the bullish trend is still going on. Secondly, the MACD line and the signal line are above the zero line which also indicates that the trend is bullish. Price of Ethereum is expected to be at the $450 previous level where it will encounter another resistance by the bears.
However, price of the asset is likely to experience upward momentum. Traders are to look for buy setups to place long trades.
ETHUSD Short-term trend: Bullish

In the daily chart, Ethereum is in a smooth uptrend with price above the 12-day EMA and 26-day EMA. As the asset price is rising, the MACD Histogram grows bigger. In an uptrend, traders are to buy low and sell high.
The views and opinions expressed here do not reflect that of CryptoGlobe.com and do not constitute financial advice. Always do your own research.


