

ETHUSD Medium-term Trend: Bearish
Resistance: $500, $450, $400
Support: $200, $250, $300
Ethereum is still under a bearish outlook. Price of the asset is trading at $370.65 and relatively stable compared to other assets that are very volatile. However, from the weekly chart, price of the asset is moving horizontally between the resistance at $400 and the support at $350. The 20-day moving average crosses below the 50-day moving average indicating that Ethereum is bearish.
Also, the RSI period 14 is level 39 indicating that Ethereum is nearing the oversold market condition. However, if the bears succeed and break the support level at $350, price will fall again to its low at $300. Traders will now look for buy setups to initiate long trades.
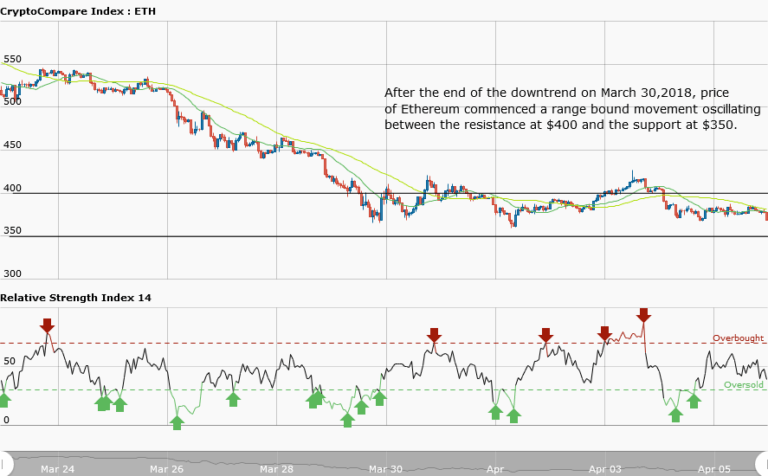
ETHUSD Short-term trend: Ranging

In the daily chart, price of Ethereum is in a range bound movement. Price is not moving in a discernible pattern therefore it is not tradable. Price is fluctuating between the resistance at $385 and the support at $375 in a choppy price action. Meanwhile, the RSI period 14 is level 36 which indicates that the market is oversold suggesting bulls taking over the market.
The views and opinions expressed here do not reflect that of CryptoGlobe.com and do not constitute financial advice. Always do your own research.


