

ETHUSD Medium-term Trend: Bullish
Resistance: $705, $700, $695
Support: $675, $680, $685
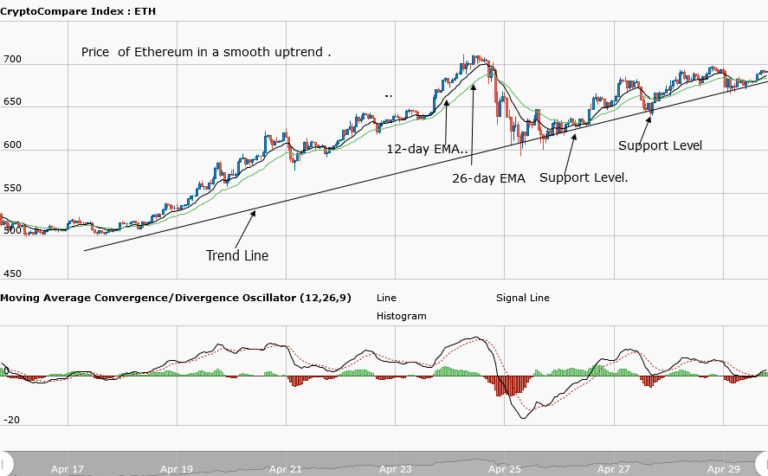
The Ethereum price was bullish all through last week. The bulls took the price from $637 to $709. The ETHUSD pair was also resisted and the price pulled back to $600. Ethereum is now back and trading in the bullish market with its MACD line and the signal line crossing above the zero line. However, the price of the asset is trading at $692.70 at the time of writing.
Today, Ethereum price is in a bullish market and it’s making a series of higher highs and higher lows. The support levels of the price can be seen on the trend line where you can place your long trades. The price bars are above the 12-day and 26-day EMA, indicating that the bullish trend is ongoing.
The price is trying to revisit the $700 and $750 highs .
ETHUSD Short-term trend: Bullish

The daily chart shows that the Ethereum price fell to $670 and started a bullish movement. The price retracements that are touching the trend lines are support levels where traders can place their long trades
The views and opinions expressed here do not reflect that of CryptoGlobe.com and do not constitute financial advice. Always do your own research.


