

ETHUSD Medium-term Trend: Bullish
Resistance: $690, $680, $670
Support: $630, $640, $650
Yesterday, the Ethereum price was bearish as indicated by the MACD line and the signal line which were below the zero line. The asset was bearish as the price pulled back. It was also range-bound between the resistance level at $640 and the support level at $600. Today the asset was trading at $661.72 at the time of writing.
The weekly chart shows that the Ethereum price broke the resistance level at $640 and it is rising towards the $709 resistance zone. The price broke out of the range-bound zone and is expected to rise because the MACD line and the signal line are now above the zero line. Also, the negative histogram has turned to a positive histogram, signaling that the asset is bullish.
However, as the resistance level at $640 is broken, the level becomes a support level. Therefore, traders are advised to place long trades at $660, with a stop loss below the support level. Ethereum price is expected to rise beyond the $800 level.
ETHUSD Short-term trend: Bullish

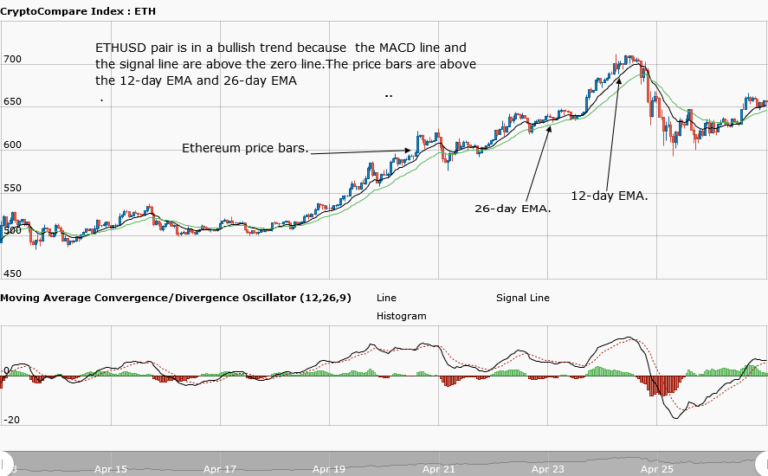
The daily chart shows the Ethereum price in a bullish market. The bulls broke the resistance level at $640 and the price is expected to reach the previous highs of the market.
The views and opinions expressed here do not reflect that of CryptoGlobe.com and do not constitute financial advice. Always do your own research.


