

ETHUSD Medium-term Trend: Bearish
Resistance: $650, $640, $630
Support: $590, $600, $610
Yesterday, Ethereum had a pullback after the bulls took the price to $709. The asset price fell as per the MACD indicators. The MACD line and the signal line are below the zero line. Today, the ETHUSD pair is in a bearish market. From the weekly chart, the price fell from $709 to $600.
Later, Ethereum made an upward movement to the $646 high and pulled back to the $600 low. Now it resumes a range bound movement. In the other words, after the price fall, the asset is fluctuating between $650 and $600. Traders will have to wait to know the actual direction of the market, whether the asset will decline further or make a range bound movement.
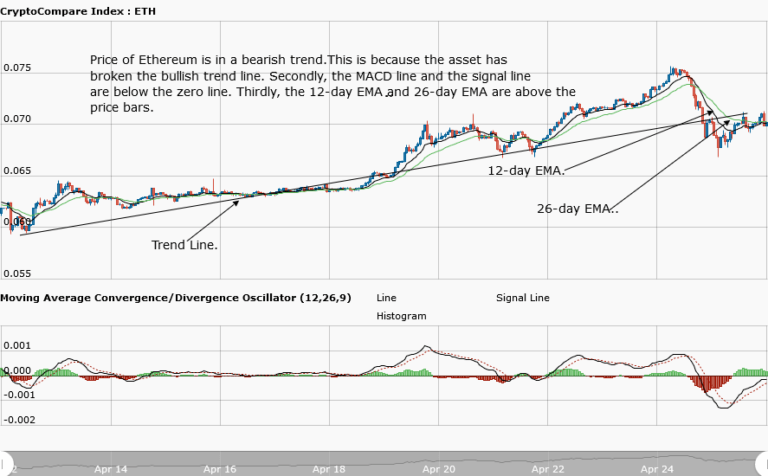
Presently, the MACD line and the signal line are below the zero line, indicating a bearish outlook. Also, the 12-day EMA and 26-day EMA are above the price bars, indicating that the downtrend is ongoing.
ETHUSD Short-term trend: Ranging

In the daily chart, the asset price is in a range bound movement, ranging between $640 and $600. We can now adopt a range-bound market strategy. When the price reaches the support level, you can place a long trade and put a stop loss below the support level. Then you can exit near the resistance zone.
On the other hand, when the price reaches the resistance level, you can place a short trade and place your stop loss above the resistance level. Then you can exit your trade near the support zone.
The views and opinions expressed here do not reflect that of CryptoGlobe.com and do not constitute financial advice. Always do your own research.


