

ETHUSD Medium-term Trend: Bullish
Resistance: $650, $645, $640
Support: $620, $625, $630
The ETHUSD pair was both in bullish and bearish markets last week. The bulls broke the resistance at $550 and Ethereum reached the $600 price level.
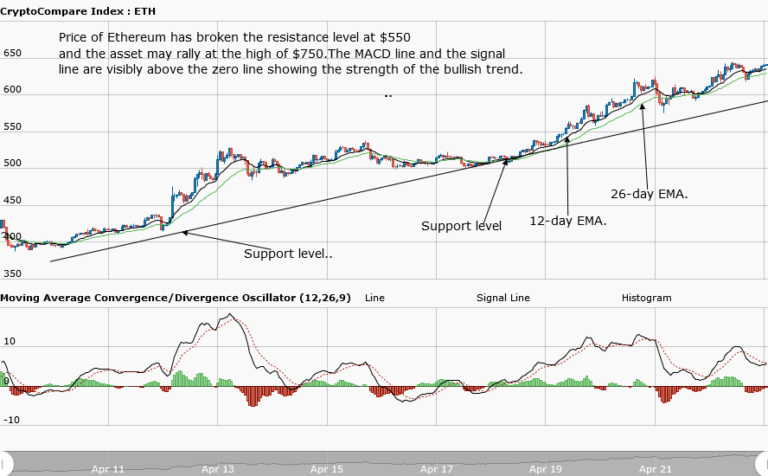
Presently, price is trading at $637.85 as at the time of writing. However, from the weekly chart, Ethereum is still in a bullish market. Price of the asset is in an uptrend. The uptrend commences at a price of $400 and makes a series of higher highs and higher lows, then reaching the high of $650. We have the bullish trend line that shows us the support levels where we can place our long trades.
The momentum of the current trend is strong therefore traders should look for buy setups to initiate long trades. Price is expected to reach the high of $750. However, the MACD line and the signal line are above the zero line showing us the strength of the bullish trend. Also, note that the price of the asset is above the 12-day EMA and 26-day EMA indicating a bullish trend.
ETHUSD Short-term trend: Ranging

In the daily chart, price of Ethereum is in a ranging market. The price of the asset rose from the low at $620 and was resisted at a price of $640 and there resumed a range bound movement. At the same price, it fell again to the low of $620 and later commenced a bullish movement.
The views and opinions expressed here do not reflect that of CryptoGlobe.com and do not constitute financial advice. Always do your own research.


