

ETHUSD Medium-term Trend: Ranging
Resistance: $410, $400, $390
Support: $350, $360, $370
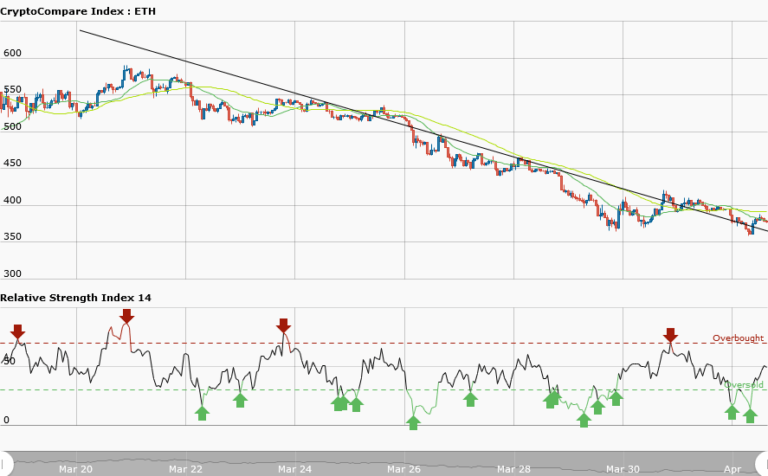
Last week, Monday 26, price of Ethereum was in a range bound movement trading between the resistance at $600 and the support at $450. However, the support level at $450 was broken the following day and Ethereum continued its decline to the level at $377.03 on Friday, March 30. Today, Ethereum is trading at $382.21. From the weekly chart, price of Ethereum has broken the bearish trend line and the candlestick closed on the opposite of the trend line.
This is a signal that the bearish outlook of Ethereum has ended. Meanwhile, the RSI period 14 is level 49 which indicates that price is in the range bound movement. I expect a breakout at the resistance level of price, after the range bound movement, because $450 level will be retested .
ETHUSD Short-term trend: Ranging

From the daily chart, Ethereum was ranging before it fell to its low at $360 where price got stalled and reversed. Presently, the bearish trend line is broken according to the weekly chart putting an end to the downtrend for now. Price is also expected to retest its previous level of $450. Meanwhile, the RSI period 14 is level 44 which indicates that price is in the range bound zone.
The views and opinions expressed here do not reflect that of CryptoGlobe.com and do not constitute financial advice. Always do your own research.


