

ETHUSD Medium-term Trend: Ranging
Resistance: $650, $600, $550
Support: $350, $400, $450
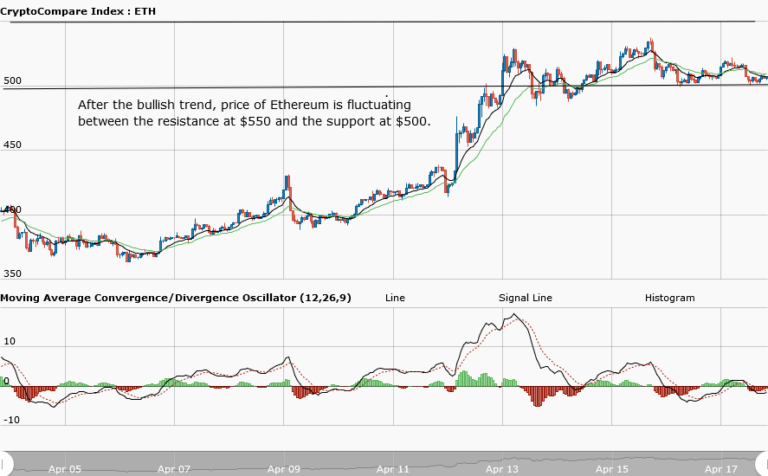
Yesterday, April 17, the MACD line and the signal line were below the zero line, indicating a bearish outlook. Also, the price broke the bullish trend line and the candlestick closed on the opposite of the trend line. Today, the Ethereum price has fallen to $507.13 at the time of writing. However, from the weekly chart, the bullish trend that was experienced on April 15, was resisted at a price of $536, thereafter, the price pulled back to the $500 level.
Since then, the Ethereum price has been fluctuating between the support level at $500 and the resistance level at $550. If the fluctuations continue, a breakout is imminent. The MACD line and the signal line cross below the zero line. Also, the MACD (faster) line crosses below the signal(slower) line, which indicates a bearish outlook. If the price breaks the support level at $500, then Ethereum will find support at $440.
ETHUSD Short-term trend: Ranging

In the daily chart, you can see the resistance level at $520 and the support level at $500. The market is moving without any particular direction. In the daily chart, the Ethereum price started at $505 and it went up to $515 to resume a range bound movement. While at $515, it fell again to $505 to start another range bound movement. This will be the scenario until Ethereum experiences a breakout at any of the key levels.
The views and opinions expressed here do not reflect that of CryptoGlobe.com and do not constitute financial advice. Always do your own research.


