

ETHUSD Medium-term Trend: Ranging
Resistance: $530, $525, $520
Support: $500, $505, $510
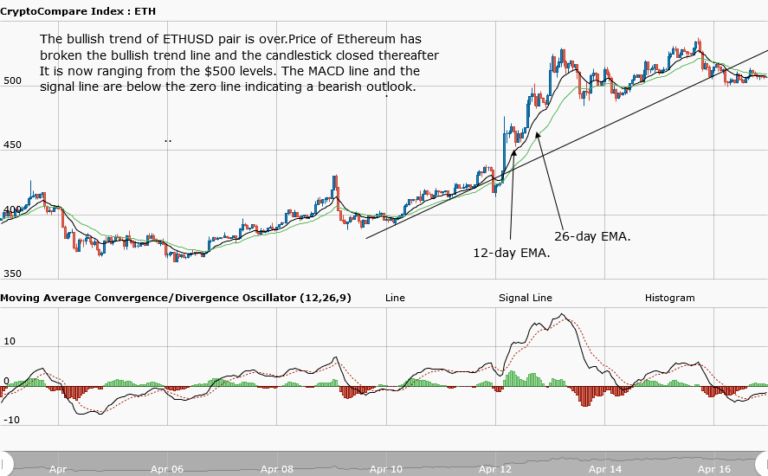
The ETHUSD pair was in a bullish trend yesterday. Also, the MACD line and the signal line were above the zero line, but today the bullish trend is over. However, from the weekly chart, Ethereum price has broken the bullish trend line, putting an end to the bullish movement. Our MACD line and the signal line are below the zero line indicating a bearish outlook.
From the price action, Ethereum had a pullback from its recent high and it it is ranging from the $500 levels. The chances that the bears breaking the support level of $500 are very slim. Rather, the bulls are expected to overcome the resistance at $550; this will enable the price to reach the other levels of $600 and $725.
ETHUSD Short-term trend: Ranging

In the daily chart, Ethereum price was fluctuating between the resistance level at $515 and support level at $500. The price pulled from $515 to $500 and commenced its range bound movement. The price touched the support level twice and bounced back to its range movement. It is attempting to break the $515 level. However, we are expecting the price to break the resistance level $550, in the long run.
The views and opinions expressed here do not reflect that of CryptoGlobe.com and do not constitute financial advice. Always do your own research.


