

ETHUSD Medium-term Trend: Bullish
Resistance: $560, $540, $520
Support: $440, $460, $480
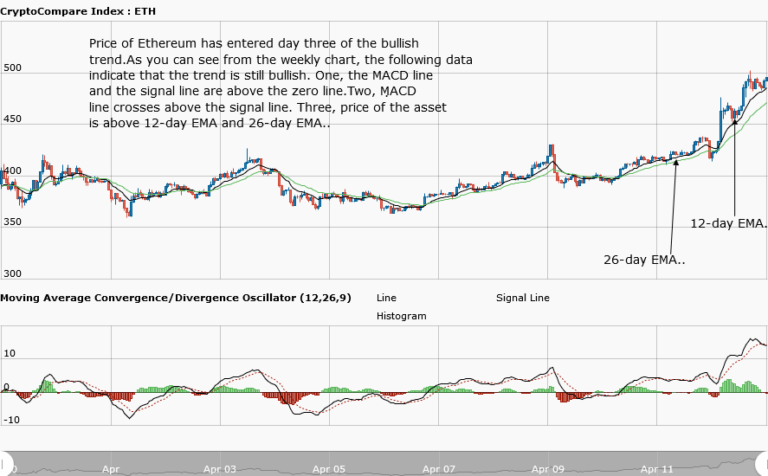
Yesterday, April 12, Ethereum price had a spike of up to $437 and later fell. The price corrections revisited the previous high of $440 and now Ethereum is trading at $510.51. However, from the weekly chart, the price action is in an uptrend. Also, the MACD indicator shows that the MACD line and signal are still above the zero line. Secondly, the MACD (faster) line is above the signal (slower) line.
Also, the ETHUSD pair is above the 12-day EMA and 26-day EMA. However, the ETHUSD pair is expected to break through the resistance at $550 so as to rally at the $600 levels.
ETHUSD Short-term trend: Bullish

In the daily chart, the 12-day EMA and 26-day EMA are below the price bars, indicating that the market is bullish. The uptrend in the daily chart is symbolic because it is detailed enough for to explain it. The resistance at $440 was broken with a large candlestick up to the $460 price level. Then at $460, the price had a range bound movement. Later, it rose up to the $500 levels. The bulls are expected to hold on and push the price forward.
The views and opinions expressed here do not reflect that of CryptoGlobe.com and do not constitute financial advice. Always do your own research.


