

ADAUSD Medium-term Trend: Bullish
Supply zones: $0.260, $0.280, $0.300
Demand zones: $0.140, $0.130, $0.120
Cardano bullish trend is sweet. The supply zone at $0.240 that was predicted on 13th April was tested early today. This was with a long bullish engulfing candle above the 50 exponential moving average at the demand zone. The bulls pushed the price to a high of $0.2448. The seller impact is sure as this is a correction for another leg of upward trend Cardano will have. Overall, the bulls are still in control. Candles opened and closed above the three exponential moving averages crossover is signaling buyers’ pressure. The moving averages are fanned apart, showing strength in the trend in context. The stochastic oscillator is above 50 percent level with its signal up indicating strong momentum to the upside. In the medium-term, the bulls are likely to push the price up to the supply zone at $0.30.
ADAUSD Short-term Trend: Bullish

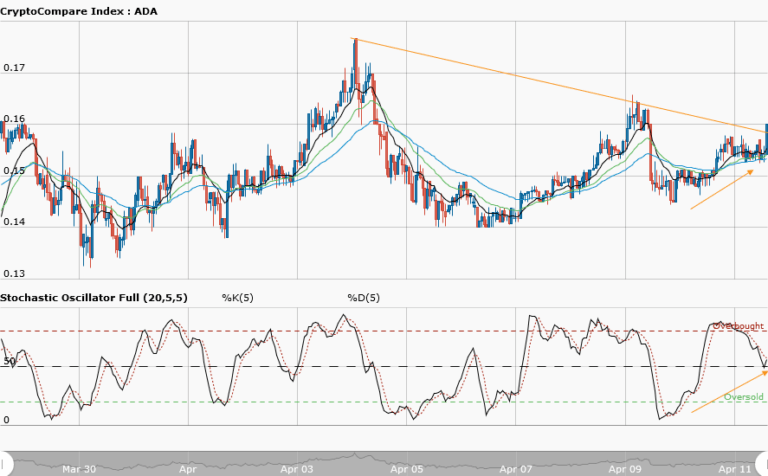
Cardano’s short-term outlook continues in the uptrend. The formation of a double top (bears signal) at the supply zone of $0.230 pushed the price down to the demand area at $0.213. This is seen as a pullback for more sensible buying as we can see that the bulls drove the price to $0.2448, its highest ever over a month period. More bullish moves are expected in the short-term. The stochastic oscillator is in the oversold area, with its signal up, meaning momentum to the upside is expected. A break and close of the daily candle above the supply zone at $0.250 is likely and this will pave the way for the bulls to push the price to $0.280.
The views and opinions expressed here do not reflect that of CryptoGlobe.com and do not constitute financial advice. Always do your own research.


