

BTCUSD Medium-term Trend: Bullish
Resistance: $7,300, $7,250, $7,200
Support: $7,000, $7,050, $7,100
Last week, Bitcoin price has been fluctuating without the bulls or the bears in control of the market. On Monday, April 2, the price was in the range of $6, 825.27 and traded up to $7,429.59 in a bullish trend. On April 5, 2018, the bears took price to as low as $6.592.27 on Friday, March 6. Today, the bulls have taken over the market and Bitcoin is trading at $7,163.87.
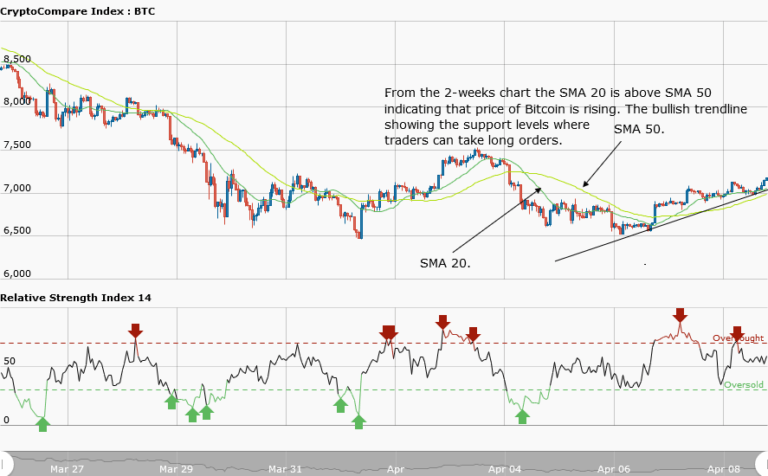
From the weekly chart, the 20-day moving average is above the 50-day moving average indicating that the price of Bitcoin is rising. Price is expected to rise to the previous level at $7,500 and may encounter resistance by the bears. In the same vein, traders can look out for buy setups. While in an uptrend, if an asset retraces from its recent high, it will create a support level where a trader can take a long trade.
All the support levels are on the bullish trend line where you can place your long trades.
BTCUSD Short-term Trend: Bullish

From the daily chart, the bullish trend line overlaps the price bars and shows the support levels where traders can initiate their long trades. Meanwhile, the RSI period 14 is level 55, which indicates that price is in the range bound zone.
The views and opinions expressed here do not reflect that of CryptoGlobe.com and do not constitute financial advice. Always do your own research.


