

BTCUSD Medium-term Trend: Bearish
Resistance: $6,950, $6,900, $6,850
Support: $6,650, $6,700, $6,750
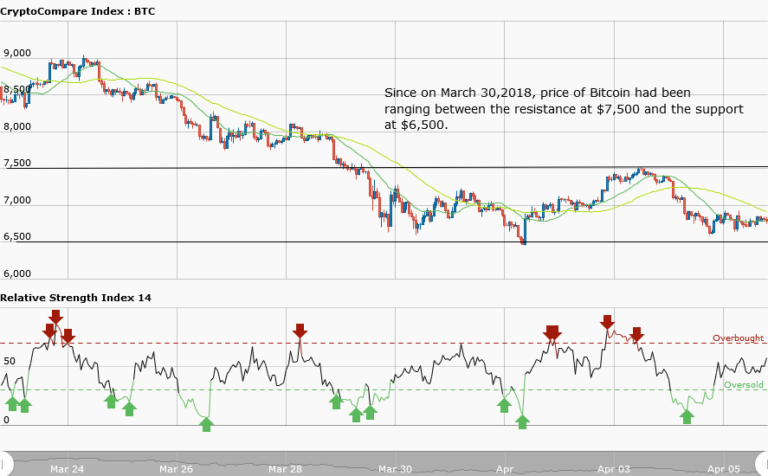
Yesterday, April 5, price of BTCUSD pair was bearish and price is still falling steadily towards the $6500 support level. Nevertheless, Bitcoin is trading at $6592.36 as at the time of writing. However, from the weekly chart, price of Bitcoin fell to its lows at $6,500 in March, this year and had been trading at that support level. Also, within that time frame, it had not traded beyond the resistance level of $7,500.
However, as price is falling, there are indications that the support level at $6,500 may be broken. If that happens, price will fall to its previous February lows at $6,075, this year. Traders will have the opportunity to place long trades from their buy setups. On the other hand, if the support at $6,500 is not broken but price fluctuates in a range bound movement.
Then traders have to adopt a range bound trading where they go long at the support level and exit near the resistance zone. Or you take a short trade at the resistance level and exit near the support.
BTCUSD Short-term Trend: Ranging

In the daily chart, price of Bitcoin is in a choppy price action. Price of Bitcoin is not evenly apart between the resistance and the support to initiate any trading. Pricing of the asset is disorderly and confusing in the daily chart. It is advisable to abstain from trading. Meanwhile, the RSI period 14 is level 41 which indicates that price is in the range bound zone.
The views and opinions expressed here do not reflect that of CryptoGlobe.com and do not constitute financial advice. Always do your own research.


