
BTCUSD Medium-term Trend: Bullish
Resistance: $9,550, $9,500, $9450
Support: $9,250, $9,300, $9,350
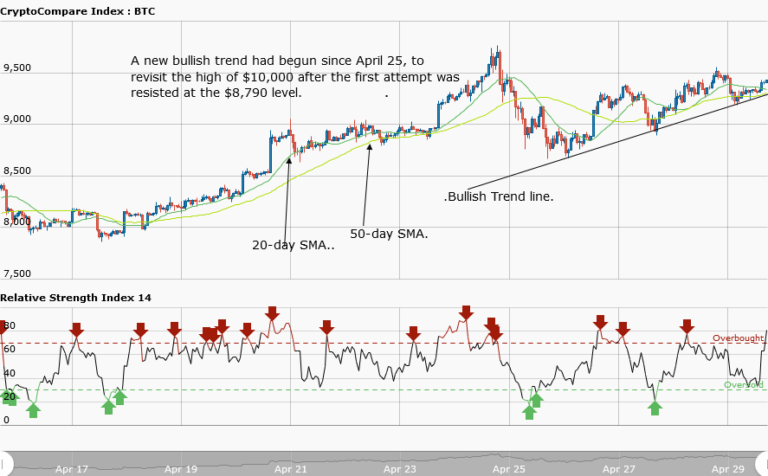
Last week, the BTCUSD pair was in a bullish market, trading from $8,884.00 to $9,727. However, the bulls were resisted at $9,727 and the price pulled back to $8,790. Later, the price went into a range-bound movement fluctuating between the resistance level at $9,000 and the support level at $8,500.
However, the price broke the resistance level at $9,000 and resumed its bullish trend. Bitcoin price is currently trading at $9,413.04. The weekly chart shows the price is making a similar attempt it made last week to reach the $10,000 high.
A bullish trend line is drawn showing the support levels in the bullish market. As mentioned earlier, as the bullish trend is ongoing, you can place long trades at the support level on the trend line. For instance, you can place a long trade at $8689, $8,949, or $9,234, with a stop loss below the trend line. By doing so you can make partial profits before the trend reverses.
BTCUSD Short-term Trend: Bullish

In the daily chart, price Bitcoin price is in a bullish market, showing the support levels where traders can place long trades. The support levels are marked with pointed arrows.
The views and opinions expressed here do not reflect that of CryptoGlobe.com and do not constitute financial advice. Always do your own research.


