

BTCUSD Medium-term Trend: Bullish
Resistance: $7,600, $7,400, $7,200
Support: $6,400, $6,600, $6,800
Yesterday, price of Bitcoin broke the bearish trend line to end the downtrend. Today, the 20-day moving average crosses above 50-day moving average signaling that price of Bitcoin is rising. Bitcoin is currently trading at $7,205.37 as at the time of writing. The first hurdle for Bitcoin is to break the resistance level at $7,500 so that price will get to its previous high of $8,000, signalling strength.
The RSI period 14 is level 14 which indicates that the market is oversold suggesting bulls taking control of the market. Traders can take advantage of buying low and selling high in a rising market. Since the market is oversold traders should look for buy setups. Price may likely rise until it face difficulty at the resistance level of $8,000.
The resistance levels of price may be breached if price continues its upward movement.
BTCUSD Short-term Trend: Ranging

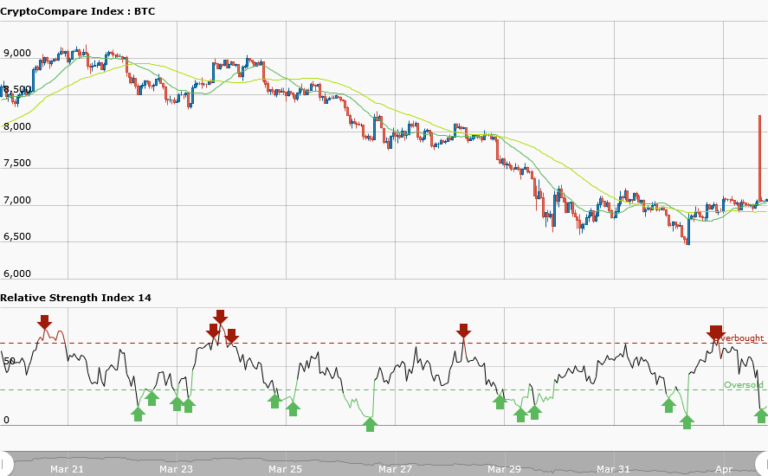
In the daily time chart, price of Bitcoin is trading in a range bound movement. Price of Bitcoin is moving horizontally at the resistance level of $7,000. The moving averages are also trending horizontally. However, the RSI period 14 is level 71 which indicates that the market is overbought suggesting bears taking control of the market. The RSI diverges with price action but the warning is that reversal of price is imminent.
The views and opinions expressed here do not reflect that of CryptoGlobe.com and do not constitute financial advice. Always do your own research.


