

BTCUSD Medium-term Trend: Bullish
Resistance: $9,500, $9,400, $9,300
Support: $8,900, $9,000, $9,100
The BTCUSD pair has been range-bound between $8,500 and $9,000 after the price pulled back and found support at $8,790. The asset has been trading between those levels for the past four days. Yesterday, I was contemplating that the price may still decline below the support level of $8,500 or rise above the resistance level of $9,000.
In any case, you should place a long trade if the price breaks the $9,000 resistance level and a short trade if the price breaks the $8,500 support level. Bitcoin is trading at $9,229.75 at the time of writing. However, the weekly chart shows that Bitcoin price has broken the resistance level at $9,000 and it is pushing ahead.
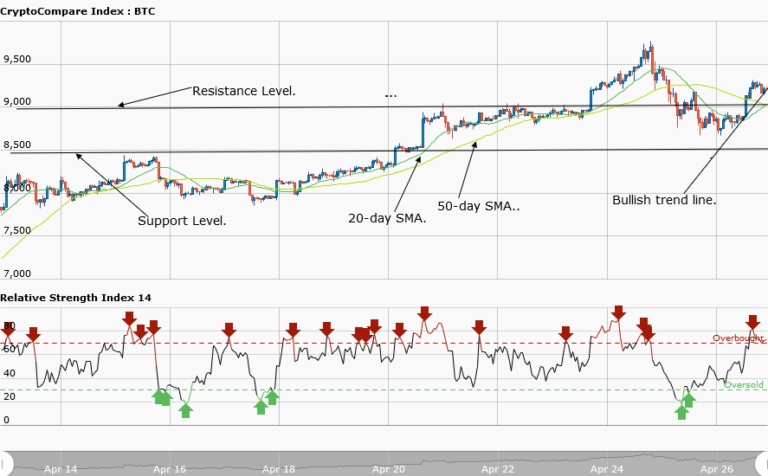
The bulls are likely to revisit the $9,727 level previously attempted while reaching the $10,000 mark. The 20-day moving average crosses over the 50-day moving average as Bitcoin price rises. As the price reaches the $9,200 level, we expect long orders to be placed in anticipation of a further price rise. This time, the price is expected to attempt to break the $10,000 mark and then rally at the $12,000 level.
BTCUSD Short-term Trend: Bullish

The daily chart shows the price in a bullish market. The bullish trend line is showing the support level where the large candlestick broke the resistance level at $9,000. However, if the price retraces from the recent high and touches the trend line without breaking it; this is a buy signal.
The views and opinions expressed here do not reflect that of CryptoGlobe.com and do not constitute financial advice. Always do your own research.


