

BTCUSD Medium-term Trend: Bullish
Resistance: $9,900, $9,800, $9,700
Support: $9,300, $9,400, $9,500
Yesterday, April 24, Bitcoin reached $9,200 and traders booked their partial profits accordingly. As the asset progresses in this bullish trend, we should take advantage of the price retracements along the bullish trend line. We can take fresh orders as the price pulls back on the trend line. The pullbacks on the trend line are support levels where we can place our long trades.
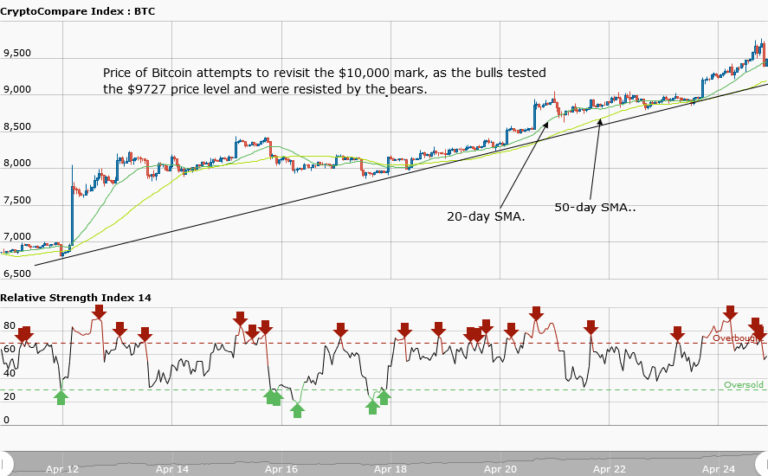
Meanwhile, the Bitcoin price is trading at $9,465.37 at the time of writing. However, in the weekly chart, the price has shown more vigor as it touched the $9,727 level, but lost control to the bears while the price fell to $9,221. As Bitcoin stabilises itself, the asset is expected to reach $10,000.
As soon as it reaches the $10,000 mark, Bitcoin will not encounter much resistance as it revisits the $11,000 price level. Meanwhile, the relative price index period 14 is level 58, which indicates that the price is in the range bound zone.
BTCUSD Short-term Trend: Bullish

In the daily chart, Bitcoin is in a bullish trend. The bulls took the price of the asset at $9,200 and rose in a bullish trend to $9727, but lost control to the bears. The bears took the price to $9,221. Also, you will find price retracements on the daily chart. These are support levels where you can initiate long trades.
The views and opinions expressed here do not reflect that of CryptoGlobe.com and do not constitute financial advice. Always do your own research.


