

BTCUSD Medium-term Trend: Bullish
Resistance: $8,500, $8,450, $8400
Support: $8,200, $8,250, $8,300
Yesterday, the Bitcoin price was expected to retest the resistance level at $8,500 and reach other levels of price. The market was rather slow in its bullish movement. For instance, yesterday it was trading at $8,209.61, but today it is trading at 8,367.39. Let’s see how the bears will react when the price gets to the $8,500 resistance level.
The assumption was that if the bulls break the $8,500 resistance level, then Bitcoin will reach the $9000 high. The $9,000 level is another resistance level which the bulls had to contend with before reaching $10,000.On the other hand, there are fears that if the price decline at $8,000 level, then Bitcoin will find support at $7,500.
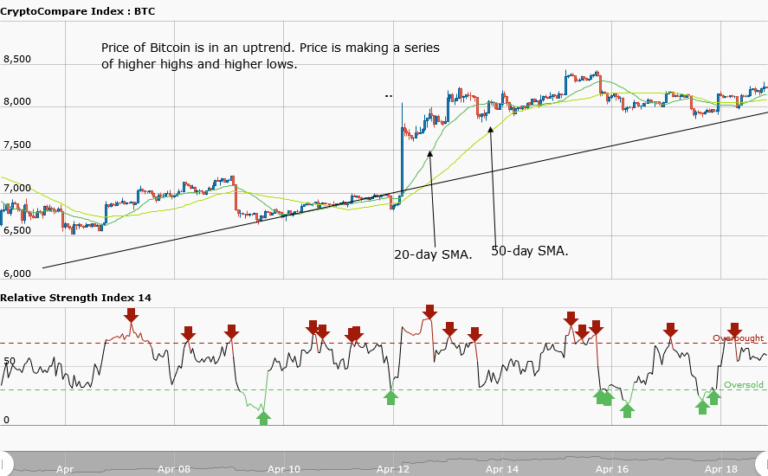
However, the bullish trend line is drawn from the price bars, showing the support levels where traders can place their long trades. The trend line will indicate when there is price reversal so that traders can exit their positions.
BTCUSD Short-term Trend: Bullish

However, in the daily chart, it was visible that the bulls have made two attempts to break the resistance level at $8,500, but without success. The bulls were resisted at a price of $8,400. The price hit the resistance, bounced back to $8,350 and started a range bound movement.
The views and opinions expressed here do not reflect that of CryptoGlobe.com and do not constitute financial advice. Always do your own research.


