

BTCUSD Medium-term Trend: Ranging
Resistance: $9,500, $9,000, $8,500
Support: $6,500, $7,000, $7,500
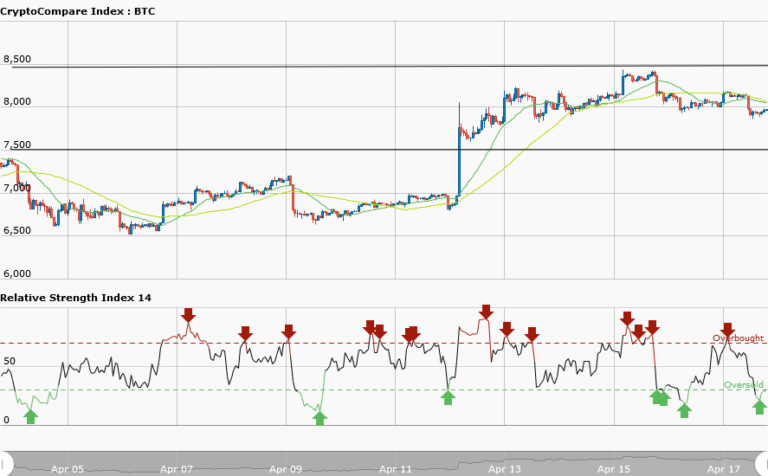
The BTCUSD pair was in a bullish trend, trading at $8,393 on April 15, when the price pulled back. As a result, the price fell yesterday and today. It is currently trading at $7,972.59. However, from the weekly chart, $8,500 is where the price faced resistance. Similarly, if the asset must decline the likely support will be $7,500.
Therefore, we will determine the direction of Bitcoin from the resistance level at $8,500 and the support level at $7,500. Meanwhile, the RSI period 14 is level 31, which indicates that the market is oversold, suggesting the bulls will take control of the market. If this happens, we expect the price to break the resistance at $8,500 and further push it to the next level at $9,000.
BTCUSD Short-term Trend: Ranging

In the daily chart, the price was at $8,050 and later rose to $8,150 to commence a range bound movement. It was at that price level that Bitcoin had another fall to the $7,900 level. The price tested that support level twice before it resumed its range bound movement. The price is still being expected to rise to the resistance level at $8,500 and, if possible, break it.
The views and opinions expressed here do not reflect that of CryptoGlobe.com and do not constitute financial advice. Always do your own research.


