

BTCUSD Medium-term Trend: Ranging
Resistance: $8,300, $8,200, $8,100
Support: $7,700, $7,800, $7,900
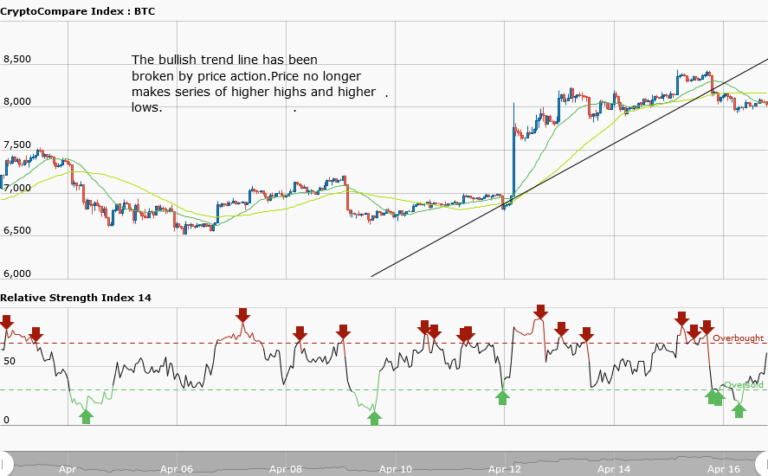
Yesterday, April 16, Bitcoin price was expected to retest the resistance at $8,500 and probably push ahead, but the recent pullback by most of the assets have made the bullish trend to be in a range bound movement. At the time of writing, Bitcoin is trading at $8,049.68. In the weekly chart, the bullish trend line has been broken by the price and the candlestick closed thereafter.
This indicates that the bullish trend is over. The price of Bitcoin is in a range bound movement; fluctuating between the levels of $8,000 and $8,500. If the price falls below $8,000, the support of the previous range will be $7,500. However, if the price breaks the resistance at $8, 500, then BTCUSD pair will move to the $9400 levels.
BTCUSD Short-term Trend: Ranging

In the daily chart, after the price pullback, Bitcoin commences a range bound movement from the $8,000 levels. In the ranging market, the price has touched the support level at $8,000 and bounced back on more than three occasions. This makes the $8,000 support level very strong and reliable. Bitcoin price will continue its range bound movement if none of the levels is broken.
The views and opinions expressed here do not reflect that of CryptoGlobe.com and do not constitute financial advice. Always do your own research.


