

BTCUSD Medium-term Trend: Bullish
Resistance: $8,600, $8,400, $8,200
Support: $7,200, $7,400, $7,600
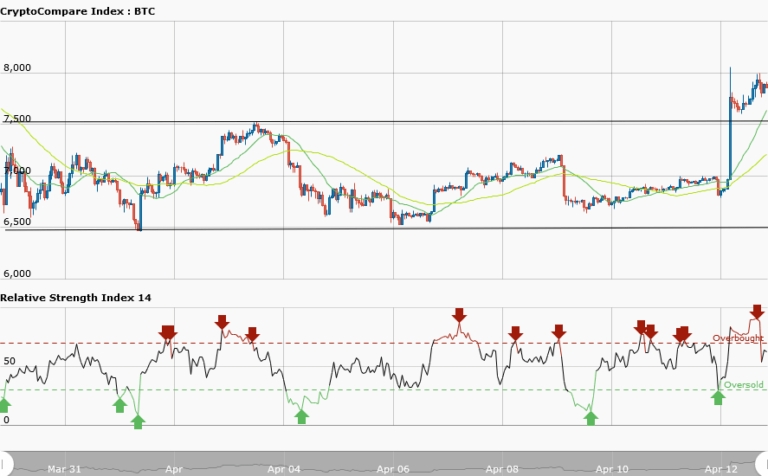
Yesterday, April 12, the BTCUSD pair overcame the initial hurdle at the resistance level of $7,100 to push the price beyond the previous level of $7,500. Yesterday, it was trading at $6,970.51, but currently at $7,843.98. Bitcoin gained about 12.5% price increase in the last 24 hours.
However, in the weekly chart, Bitcoin has moved out from the range bound zone of the support level at $6,500 and the resistance level at $7,500. The price broke through the initial hurdle at $7,100 and came out from the range bound zone. Bitcoin stayed in that range bound zone for about two weeks and now the next move will be to revisit the previous level at $8,500. However, the RSI period 14 is level 64, which indicates that the price is in the bullish trend zone.
BTCUSD Short-term Trend: Bullish

Bitcoin price is in a bullish trend. In the daily chart, the price was in a range bound movement at $6,800 before the bullish breakout occurred, taking the price to $8,000. Later, the price retraced to $7,800 and resumed its range bound movement. Bitcoin price is expected to rise because the bullish pressure is not over.
The views and opinions expressed here do not reflect that of CryptoGlobe.com and do not constitute financial advice. Always do your own research.


