

BTCUSD Medium-term Trend: Ranging
Resistance: $7,150, $7,100, $7,050
Support: $6,800, $6,850, $6,900
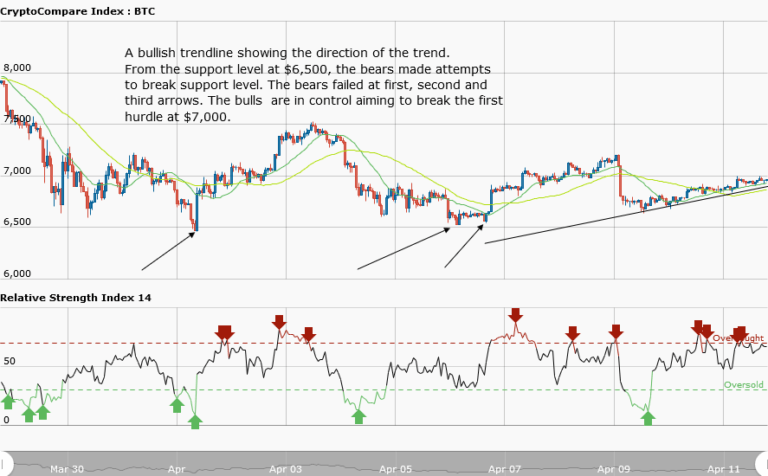
The price of Bitcoin has been quiet in the last two days with no activity. Today, the price of Bitcoin is in a bullish trend. It is currently trading at $6,970.51 as at the time of writing. From the weekly chart, a bullish trend line is drawn showing the direction of the bullish trend. Now the bears had made three attempts in the month of April 2018 to break the support level at $6,500 without success.
The support level at $6,500 will be a good entry point for intending traders because of the failed attempts by the bears. A key level becomes strong when tested for at least twice.However, price is expected to revisit its previous level at $7, 500, if they can overcome the resistance level at $7,000.
BTCUSD Short-term Trend: Bullish

In the daily chart, you can see the expanded view of price of Bitcoin. The bullish trend line and the pointed arrows show the support levels of price where traders can place long trades. The uptrend is making a series of higher highs and higher lows. In an uptrend, if an asset retraces from the recent high, it will create support level. Traders who wish to go long can enter a position as the price pulls back to its support level.
The views and opinions expressed here do not reflect that of CryptoGlobe.com and do not constitute financial advice. Always do your own research


