

BTCUSD Medium-term Trend: Ranging
Resistance: $7,050, $7,000, $6,950
Support: $6,750, $6,800, $6,850
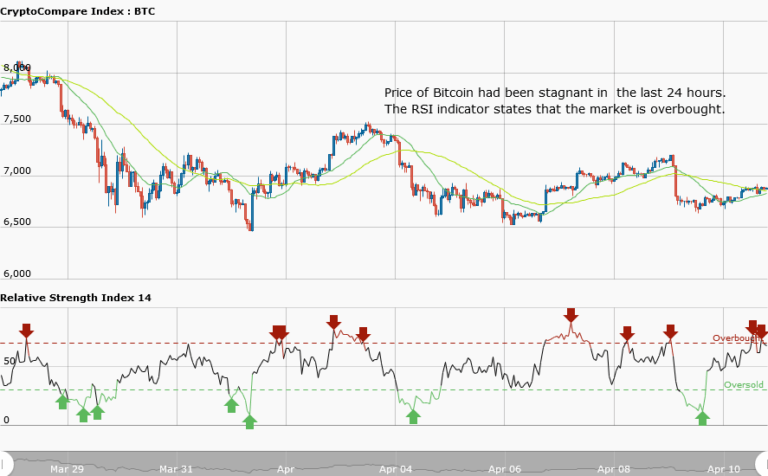
The BTCUSD pair has been stagnant in trading since the last 24 hours. Yesterday, April 10, the Bitcoin price was $6,786.67, but today it is trading at $6,862.97 at the time of writing. This is about 1.1% price increase. In the weekly chart the Bitcoin price is at the support level, trading at $6,862.97. The bulls were expected to have pushed the price to the previous level of $7,500, but it is still at the support level after 24 hours.
Neither have we seen the bears breaking the support level to the previous low. Nevertheless, the RSI period 14 is level 73 which indicates that the market is overbought, suggesting bears taking control of the market. The bulls may still take control of the market.
BTCUSD Short-term Trend: Bullish

In the daily chart the Bitcoin price is in a bullish trend. And in a bullish trend, the price is expected to make a series of higher highs and higher lows as it pushes forward to the previous high. The bullish trend line shows the support levels of price, where traders can take long trades. However, if the price breaks the trend line, then the bulls have lost possession to the bears and the bullish trend is coming to an end.
The price may revisit its previous low or break the support level then.
The views and opinions expressed here do not reflect that of CryptoGlobe.com and do not constitute financial advice. Always do your own research.


