

ZECUSD Medium-term Trend: Bearish
Supply levels: $385, $380, $375
Demand levels: $355, $360, $365
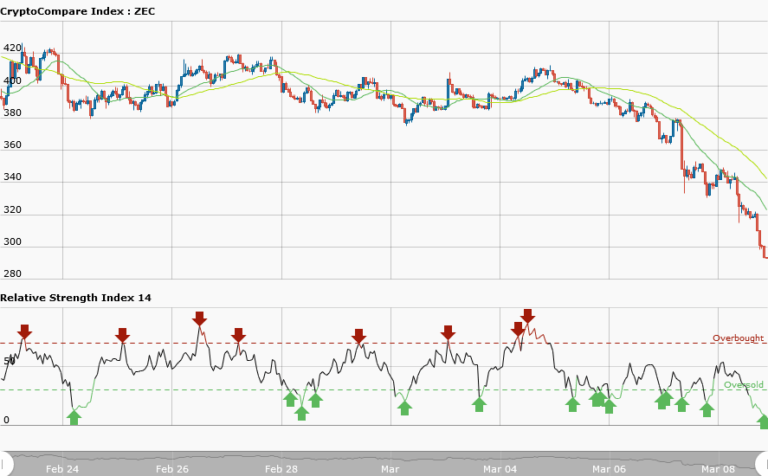
Yesterday, March 8, the price fell initially from $380 to $335 and nosedived to the level of $280 as result of the negative news. The price at $280 is a support level where a trader can initiate his long trades. It is currently trading at $295.69 .Meanwhile; 50-day moving average and 20-day moving average are trending southward. While the RSI period 14 is level 9 which indicates that the market is oversold suggesting bulls takeover of the market. .
It is assumed that the sell off on crypto currencies is over. Traders should expect bullish orders and look for buy setup to initiate their trades.
ZECUSD Medium-term Trend: Bearish

In the short term trend, the daily chart shows the downtrend of ripple price .However, 50-day moving average and 20-day moving average are trending southward .While the RSI period 14 is level 21 which indicates that the market is oversold suggesting bulls takeover of the market. The bears have exhausted the control of the market and now it is the turn of the bulls.


