

ZECUSD Medium-term Trend: Ranging
Supply levels: $244, $243, $242
Demand levels: $238, $239, $240
From the weekly chart, ZCash is still in the range bound movement. The price was ranging between the resistance at $280 and the support at $220 as at March 26, 2018. Today, the price of ZCash has a false breakout at the support of $220 and later resumes its range bound movement. However, since the direction of the market is not discernible in a ranging market traders should abstain from trading.
Meanwhile, the RSI period 14 is level 37 which indicates that price is at the oversold market condition.
ZECUSD Short-term Trend: Bearish

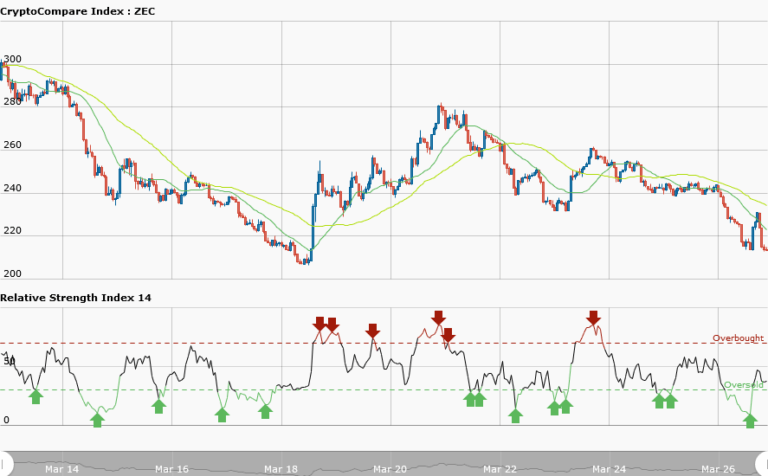
In the daily chart, the price of ZCash is in a downtrend. The bearish outlook has a price retracement which later commences the downward movement. These retracements are what we call resistance levels where traders can place short traders as the price pulls back and later resumes its bearish movement.
Meanwhile, the RSI period 14 is level 41 which indicates that the price is in a range bound zone.
The views and opinions expressed here do not reflect that of CryptoGlobe.com and do not constitute financial advice. Always do your own research


