

ZECUSD Medium-term Trend: Ranging
Supply levels: $280, $275, $270
Demand levels: $250, $255, $260
ZCash Price Key Highlights:
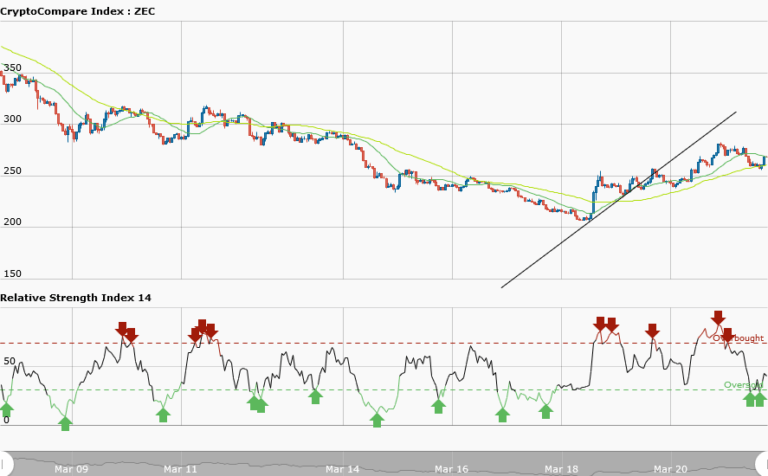
- ZCash price has broken the bullish trend line.
- Price in a range bound movement.
- Technical indicator price analysis
ZCash was in a bullish market yesterday. However, the price of ZCash broke the bullish trend line and the candlestick closed on the opposite of the trend line.
The consequence of this breakout is that the current trend comes to an end and commences a range bound movement. Ranging market usually result in a breakout. Meanwhile, in the short term trend, the RSI period 14 is level 70 which indicates that the market is overbought suggesting bears to take control of the market.
Now if the bears break the support level, traders are advised to short their trades because of the breakout. Though, this will also results in price falling to its previous low.However, in the medium term trend, the RSI period 14 is level 44 which indicates that the price is in the range bound zone.
ZECUSD Short-term Trend: Ranging

In the daily chart, you find ZCash in a range bound movement. The price of ZCash is oscillating between the resistance at $275 and support at $260. The market is not tradable because of its unpredictable movement.


