

ZECUSD Medium-term Trend: Bullish
Supply levels: $260, $255, $250
Demand levels: $230, $235, $240
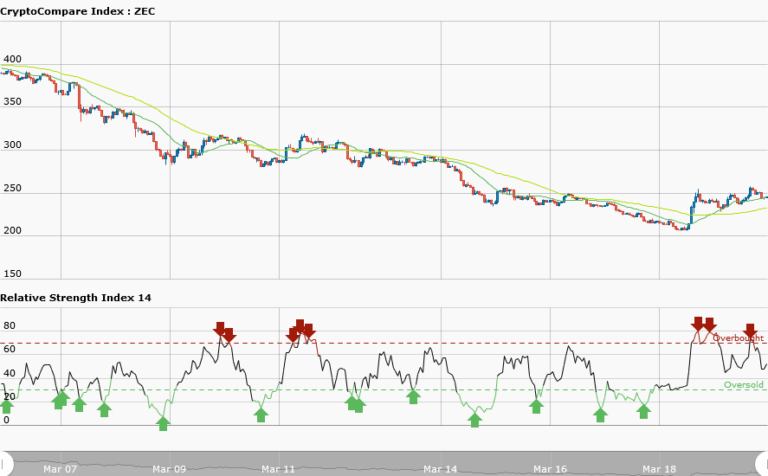
Yesterday, from the weekly chart, ZCash was in a downtrend with a bearish trend line showing the resistance levels of price. The price broke the bearish trend line to end the current downtrend and commenced bullish trend. Today, the 20-day moving average is above the 50-day moving average which indicates that the price is rising. ZCash is currently trading at $243.35.
However, the RSI period 14 is level 52 which indicates that the average gains are higher than average losses.
ZECUSD Short-term Trend: Bullish

In the daily chart, the price of ZCash is making higher highs and higher lows but later there was price retracement. The 50-day moving average and 20-day moving average are trending northwards. In a bull market, a trader should buy low and sell high. Secondly, in a bull market the price will always retrace or have downward corrections. When you have such setups you should initiate a long trade as the price pulls back to its support level.
Meanwhile, the RSI period 14 is 6o which indicates that price is in the bullish trend zone.


