

ZECUSD Medium-term Trend: Bearish
Supply levels: $410, $405, $400
Demand levels: $380, $385, $390
On March 1, ZECUSD pair was trading in a sideways market. The sideways market was tradable because the key levels were evenly apart. Today, the Zcash is in a downtrend at a price of $393.43. From the weekly chart, you can see possible resistance level where you can short. We can trade a downtrend in the following ways. Firstly know that a downtrend is present when prices make a series of lower highs (LH) and lower lows (LL).
Secondly, in a downtrend, if prices retrace from a recent low, a resistance level would be created. This gives traders the opportunity to short. Lastly, if the trend does not continue, you can exit your position. On the other hand, if the trend does continue, you could profit several times the amount you initially risk to enter the trade.
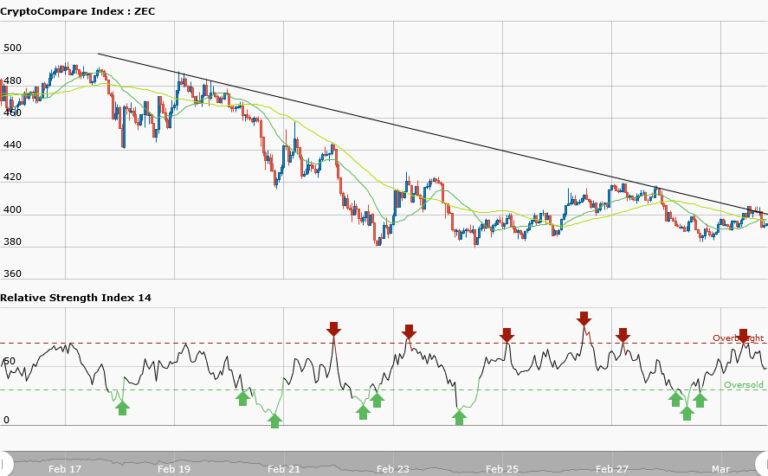
ZECUSD Short-term Trend: Sideways

Ripple price is in a sideways movement in the short term trend. The sideways movement has choppy price action and therefore not tradable. The 50-day moving average and 20-day moving average are trending horizontally whereas the RSI period 14 is level 62 indicates that price is in the bullish trend zone.


