

ZECUSD Medium-term Trend: Sideways
Supply levels: $320, $315, $310
Demand levels: $290, $295, $300
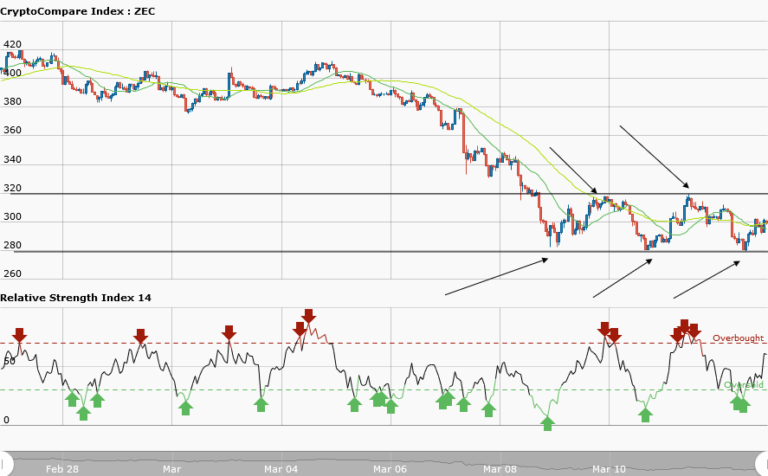
Yesterday, March 12, ZECUSD pair was moving in a sideways (ranging) trend. The price was oscillating between the support at $280 and the resistance at $320. From the weekly chart the sideways trend continues today. The price has not been able to break the support level of $280 and the resistance level of $320. Therefore since the trend is ranging you can take a short position at the resistance level and exit near the support zone.
Similarly, take a long position at the support level and exit near resistance zone . If the price breaks any of these key levels that would end the sideways trading. Meanwhile, the RSI period 14 is level 60 which means that the price is in a sideway trend zone.
ZECUSD Short-term Trend: Bullish

Yesterday, ZCash was also trading in the bullish trend and a bullish trend line was drawn showing the support levels where traders could place long trades. Today, the price is still in a bullish trend as at the time of writing. However, in subsequent reports you will see that the price has broken the bullish trend line to form a sideways trend.


