
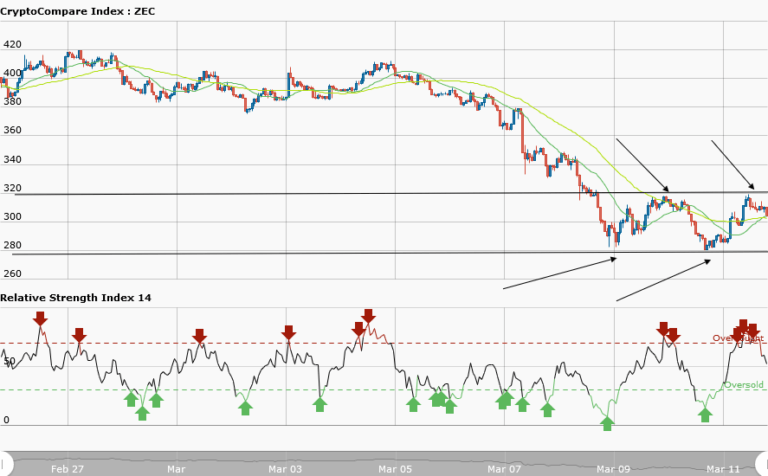

ZECUSD Medium-term Trend: Sideways
Supply levels: $320, $315, $310
Demand levels: $290, $295, $300
Last week Monday, ZCash was in a sideways movement trading at $397.88. However, it was under the control of the bears on Tuesday, Wednesday, Thursday and Friday trading at $280. In the other words, a decline in price of about 29.6% which was due to negative news. It was assumed that the selloff was over.
Meanwhile it is currently trading at $300.46. From the weekly chart, ZECUSD pair is moving in a sideways (ranging) market. The price at $280 is the support where the price got stalled last Friday. While the price at $320 is the resistance level. If you have followed the sideways trend from its inception last Friday, then you are expected to place a short trade at the resistance and exit near the support zone.
Also, place a long trade at the support and exit near the resistance zone. The orders should match the numbers of arrows. However, the RSI period 14 is level 54 which indicates that average gains are higher than average losses.
ZECUSD Medium-term Trend: Bullish

In the short term trend, ZECUSD pair is in a bullish market showing the support levels where you can place long trades. When price touches the trend line a buy setup is established but if it breaks the trend lines the bullish trend will come to an end. The RSI period 14 is level 19 which indicates that the market is oversold suggesting bulls taking over of the market.


