

XRPUSD Medium-term Trend: Bearish
Supply Levels: $0.92, $0.90, $0.88
Demand levels: $0.80, $0.82, $0.84
Yesterday, I said that the prospect of a rise in Ripple price is very slim because its price is always fluctuating. It is currently trading at $0.84. Yesterday the market fell from $0.90 to $0.79. The price of Ripple is expected to rise today because it has reached the support level of the market. Traders can initiate a long order so as to catch the bullish trend at its inception.
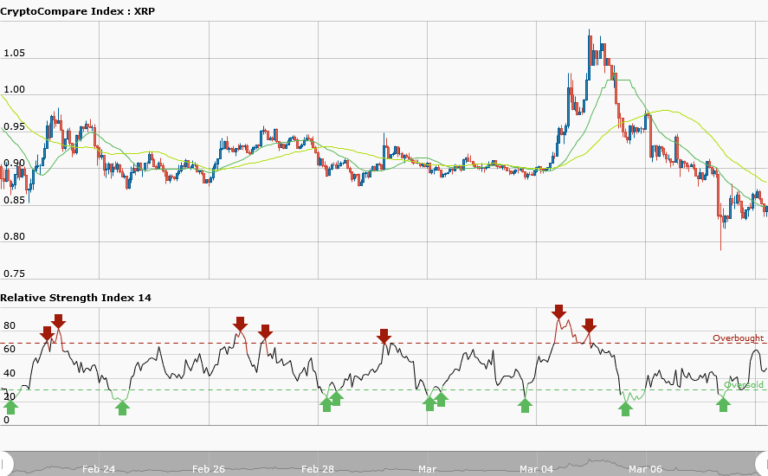
Meanwhile, 50-day moving average and 20-day moving average are trending southward whereas the RSI period 14 is level 45 which indicates that the market is in the sideways trend zone.
XRPUSD Short-term Trend: Sideways

Yesterday, from the daily chart the price fell from $0.89 to $0.79 and later commenced a sideways movement. The price is currently oscillating between the levels of $0.89 as the resistance level and $0.79 as the support level. It is not advisable to trade the sideways market because of the choppy price action. But if you must trade it you place a short order at the resistance and exit near the support zone.
Also, you take a long order according to the number of arrows and exit near the resistance zone.


