

XRPUSD Medium-term Trend: Bullish
Supply Levels: $1.25, $1.20, $1.15
Demand levels: $0.95, $1.00, $1.05
Last week the XRPUSD pair was trading between $0.88 and $0.93.It was either in a bearish market or in a sideways market. Today, ripple price is trading at $1.06 and in a bullish market. From the weekly chart, the pair has been in a sideways movement at the demand level of $0.90 before the commencement of the bullish trend.In a sideways market we can set our pending orders at the demand levels of the market.
If we had set our pending orders at $0.90 and at a stop loss of $0.85 we would have been in the bullish market. Now in the bullish market we can looked out for price retracement in the uptrend. Traders who wish to go long can enter a position when price pulls back to its support level. Also note that if the trend does not continue, you can exit your position.
On the other hand, if the trend does continue, you could profit several times the amount you initially risk to enter the trade.
XRPUSD Short-term Trend: Bullish

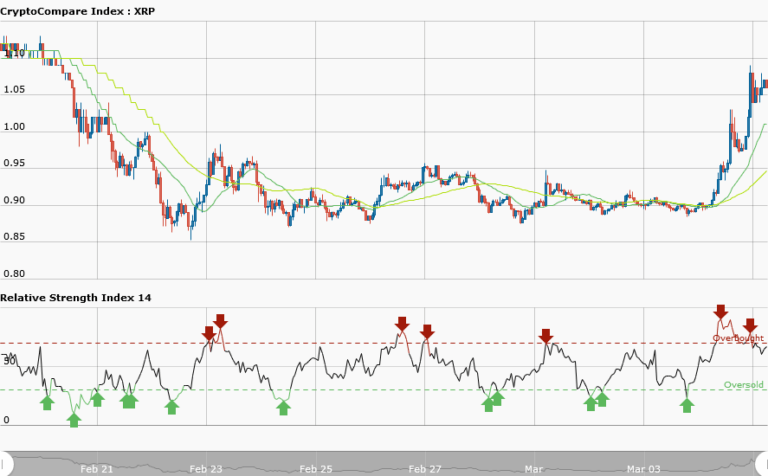
The short term trend is bullish. The 50-day moving average and 20-day moving average are trending northward whereas the RSI period 14 is level 50 indicates that the average gains are higher than the average gains.


